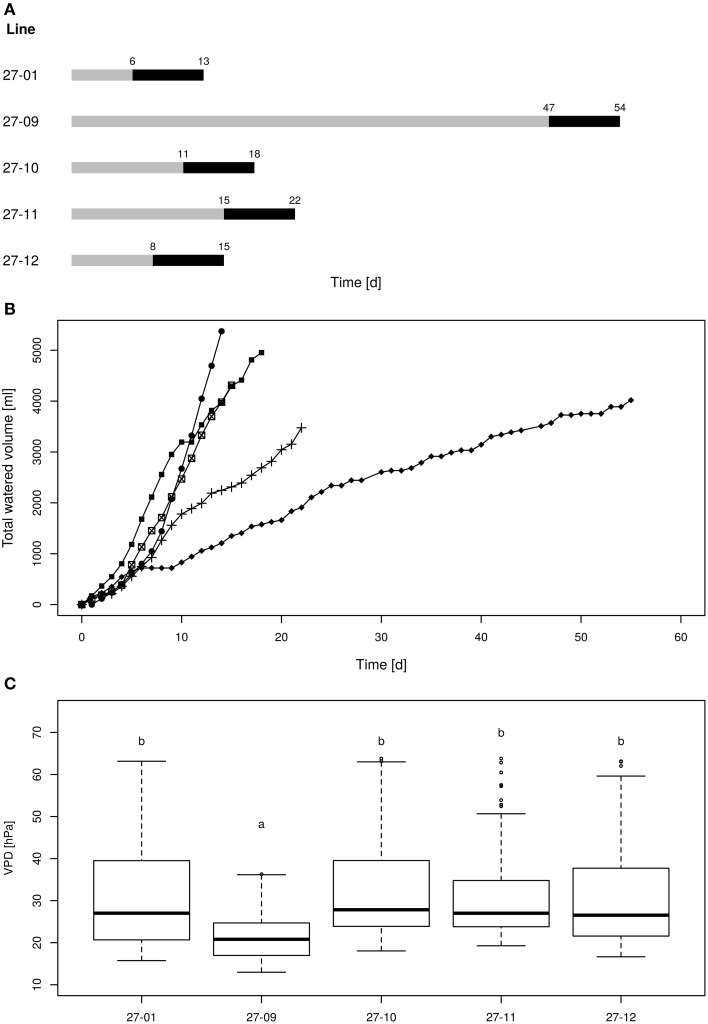
Figure 4.
(A) Scheme of the drought periods, (B) cumulative water volumes applied to each line, (C) vapor pressure deficit during the 10 vol.-% levels [gray line: drying period until the 10 vol.-% soil moisture level was reached for all plants of one line, black line: 10 vol.-% soil moisture period; 27-01: circles, 27-10: squares, 27-11: crosses, 27-12: crossed squares. Boxplots are defined as explained in Figure 3. Different letters at the top of the boxes indicate significant differences between the lines (TukeyHSD test, p < 0.05)].

