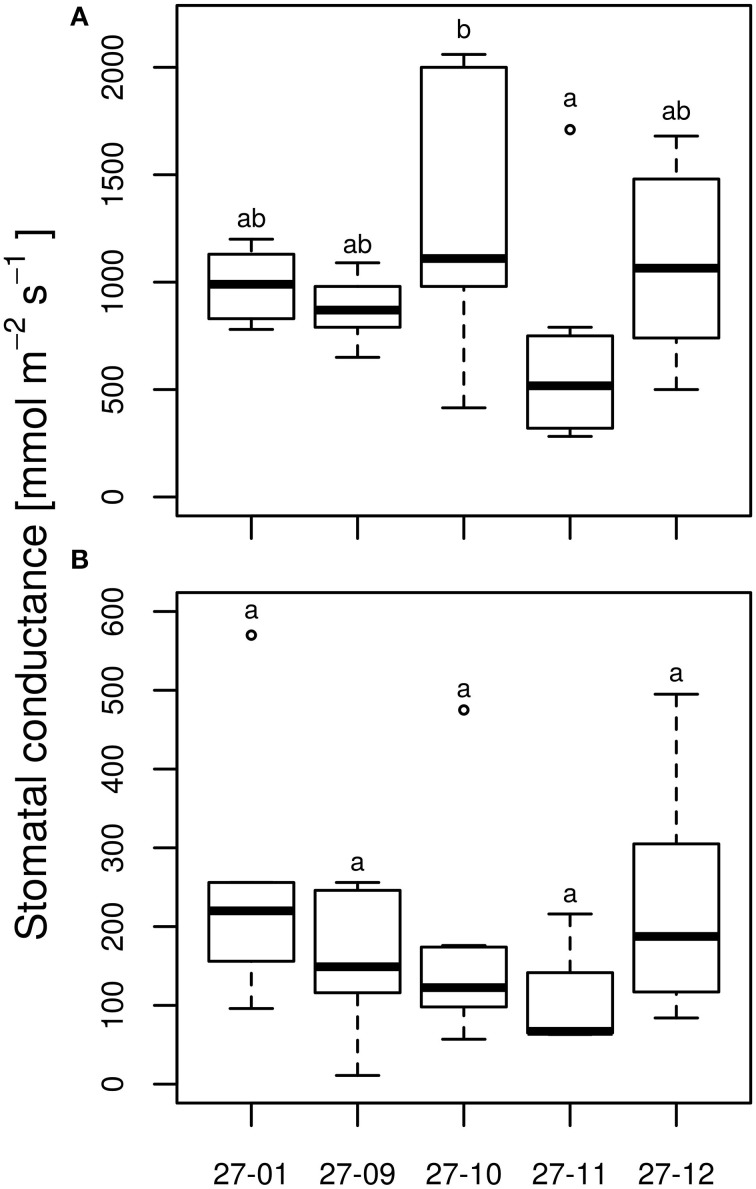
Figure 7.
Stomatal conductance at the end of 10 vol.-% soil moisture level (A) watered plants, (B) drought-exposed plants. [n = 10 plants. Boxplots are defined as explained in Figure 3. Different letters at the top of the boxes indicate significant differences between the lines (TukeyHSD test, p < 0.05)].

