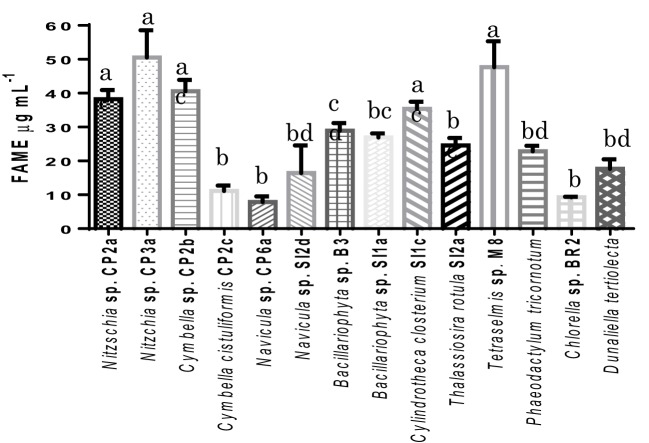
Figure 3.
Total fatty acid methyl esters (FAMEs) contents of the isolated microalgal strains, expressed in μg mL−1. Shown are mean values ± SEs from three separately-grown cultures. Different letters above bars indicate statistically significant differences (p < 0.05; Two-Way ANOVA, Tukey's HSD test using GraphPad Prism 6.0).

