Figure 2.
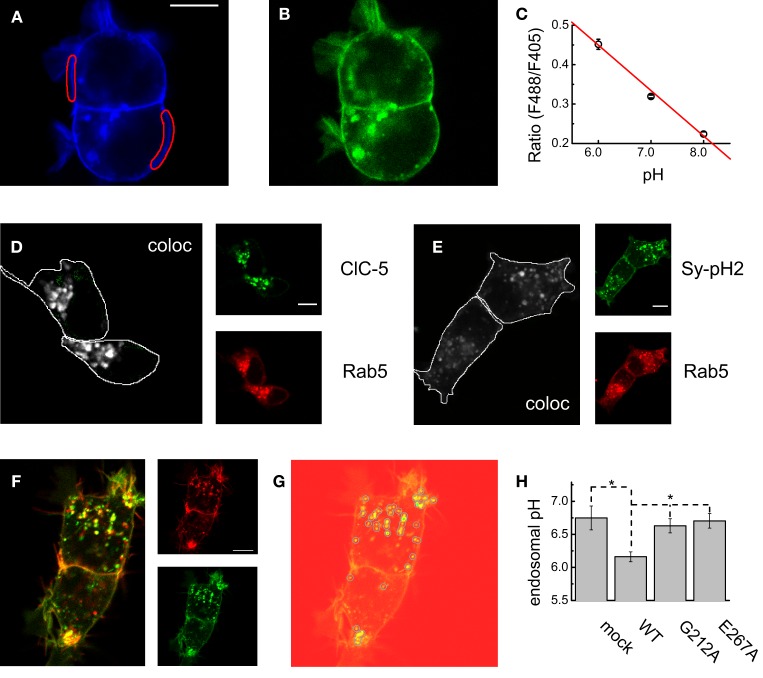
Luminal pH in WT and disease-associated ClC-5-containing endosomes. (A,B) Representative confocal images of cells expressing synpto-pHluorin2 excited at 405 nm (A) and 488 nm (B) and both detected at a wavelength of 530 nm. For the analysis, membrane regions as depicted in (A) were selected and the fluorescence intensity in both channels was measured. (C) Calibration curve constructed from measurements as depicted in (A,B). The ratios were obtained by taking confocal images from cells (n = 6 cells for each experimental point) bathed in solutions with pH-s as indicated and containing nigericin to equilibrate the extracellular and intracellular acidity. The calibration curve was constructed by fitting a straight line to the data. (D) Representative cellular distribution and map of the colocalizing pixels for coexpressed Rab5-RFP and ClC-5-YFP expressed in HEK293T cells. (E) Representative cellular distribution and map of the colocalizing pixels for coexpressed Rab5-RFP and synapto-pHluorin2 expressed in HEK293T cells. (F) Representative confocal images as used for determining intravesicular pH. The large image represents the overlay of the fluorescence using 560 nm laser line to excite the mCherry attached to ClC-5 (red) and the 488-nm laser line to excite the synapto-pHluorin2 (green) molecules. Both channels are represented as small sub-images at the right of the overlay; for simplicity, the 405-nm channel was not depicted. (G) Illustration of the particle identification procedure used to select individual vesicular regions in the red channel (ClC-5-containing endosomes) and used to measure the fluorescence intensities in both pHluorin2 channels. The identified particles are overlaid as circles on the red channel of the cells depicted in (F). For measuring of endosomal pH in cells not transfected with ClC-5, particle detection was performed analogously using the florescence images taken in the blue channel (405-nm excitation). (H) Average vesicular pH determined as depicted in (F,G) for cells transfected with synapto-pHluorin2 only (mock, n = 7) or cotransfected with synapto-pHluorin2 and either WT, G212A or E267A ClC-5 (n = 18, 18, 9, respectively). First, the ratio of the intensities of the blue and green channels (excitation at 405 and 488 nm, both detected at 530-nm wavelength) was calculated and this ratio was subsequently converted to absolute pH using the calibration curve depicted in (C). Significant differences at the level of 0.05 are indicated as stars.

