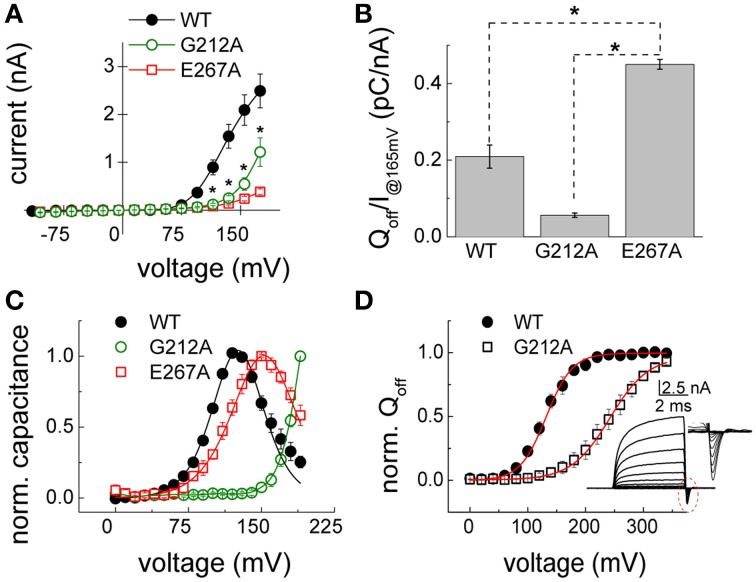
Figure 5.
Gating properties of the disease associated mutations G212A and E267A ClC-5. (A) Averaged current–voltage relations constructed by measuring the steady-state current amplitudes at the end of voltage steps in the indicated range as depicted in Figures 3D–F for cells expressing either WT (n = 5), G212A (n = 6) or E267A (n = 11) ClC-5. Significant differences (for both mutants vs. WT ClC-5) at the level of 0.05 are indicated as stars. (B) Ratio between the off-gating charge (Qoff) and ionic currents (I) at +165 mV [n = 5.11, same cells as in (A)]. Significant differences at the level of 0.05 are indicated as stars. (C) Voltage dependence of the non-linear capacitances of WT and G212A and E267A ClC-5 determined by using lock-in based impedance measurements. The curves for E267A and WT ClC-5 exhibit the typical bell-shaped form and were fitted with the first derivative of a standard Boltzmann function with the peak corresponding to the half-maximal activation (E267A ClC-5 - V0.5 = 153 ± 2 mV, n = 5; WT ClC-5 - V0.5 = 128 ± 2 mV, n = 5). The curve for mutation G212A did not exhibit a peak within the investigated range and was not fitted. (D) Voltage dependence of the activation of mutation G212A WT as obtained from gating current measurements. The inset depicts a representative recording from WT ClC-5 measured with short pulses. The encircled region is additionally depicted enlarged to show the off-gating currents that were integrated to obtain the gating charge Qoff. The red lines represent Boltzmann fits to the data to obtain the half maximal voltage of activation (G212A and WT ClC-5, respectively, V0.5 = 240 ± 10 mV, n = 4 and V0.5 = 132 ± 6 mV, n = 4).

