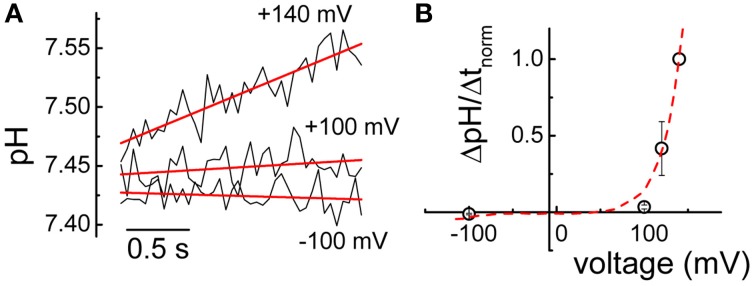
Figure 6.

Proton transport mediated by mutation G212A. (A) Representative alkalinization recorded at different voltages in a cell transfected with mutation G212A ClC-5 using ratiometric BCECF fluorometry. Lines represent linear fits to the data and were used to provide the rates of alkalinization ΔpH/Δt. (B) Averaged rates of alkalinization normalized to the value measured at +140 mV (n = 5). The red line represents the current–voltage relation of G212A ClC-5 depicted in Figure 5A and analogously normalized to the current measured at +140 mV.
