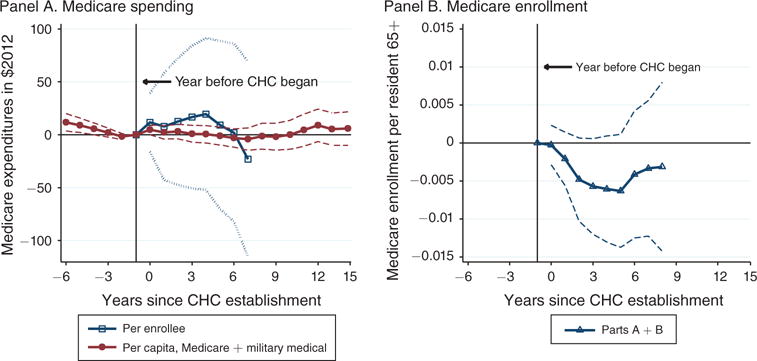
Figure 8.

Relationship between Community Health Centers and Medicare Utilization
Notes: The figure plots weighted least-squares estimates of π and τ from our baseline specification of equation (1). The dependent variable in panel A is real ($2012) Medicare spending per enrollee and in panel B it is the Medicare enrollment rates in parts A and B (enrollees divided by county population 65 and older). In treated counties in the year before CHC establishment, the sample means are 0.97 and 0.93 for enrollment in parts A and B, $1,089.83 for per-enrollee spending on part A, and $429.22 for B. 1973 is missing and is linearly interpolated. Data from July 1966 through December 1967 is allocated to calendar years 1966 and 1967 in proportion to the number of months (1/3 and 2/3).
Sources: County level Medicare (US SSA 1969–1977; US HFA 1978–1980) and the Area Resource File (US DHHS 1994). Data on Medicare and military medical expenditures (panel A) were shared by Almond, Hoynes, and Schanzenbach (2011)
