
FIGURE 3.
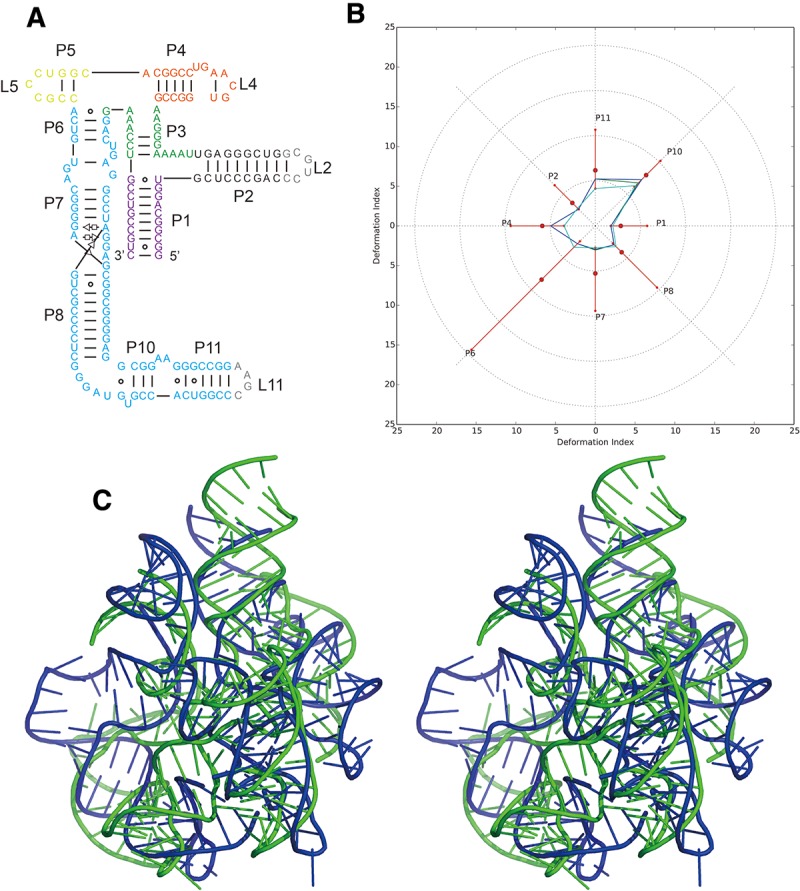
Problem 6: the adenosylcobalamin riboswitch (A) secondary structure and (B) Deformation Profile values for the three predicted models with lowest RMSD: Das model 4 (green), Das model 6 (blue) and Das model 2 (cyan). (Radial red lines) The minimum, maximum, and mean DP values for each domain. (C) Structure superimposition between native structure (green) and best predicted model (blue, Das model 4) with wall–eye stereo representation.