
FIGURE 4.
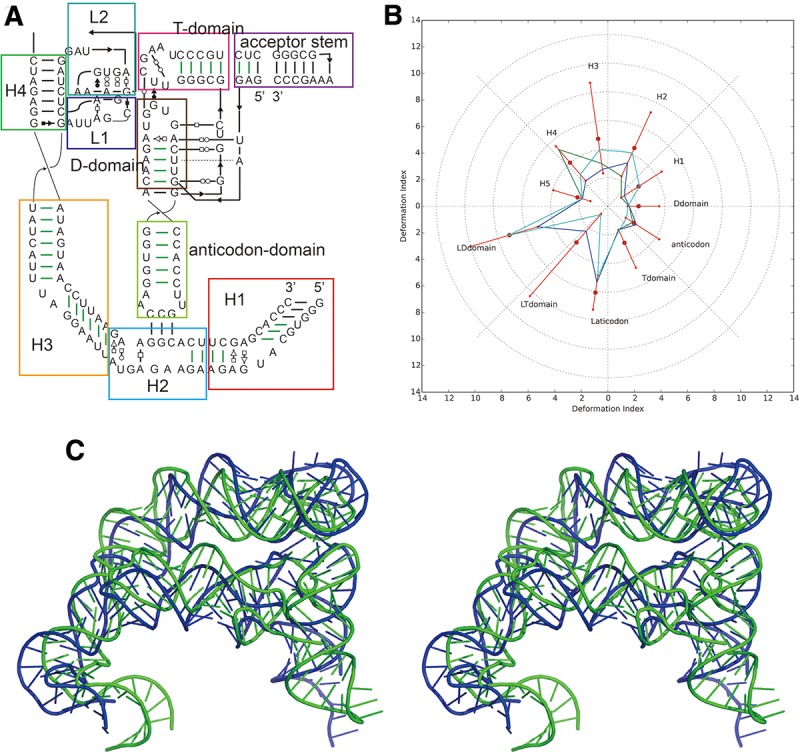
Problem10: the T-box–tRNA complex (A) secondary structure and (B) Deformation Profile values for the three predicted models with lowest RMSD: Das model 3 (green), Das model 4 (blue), and Das model 1 (cyan). (Radial red lines) The minimum, maximum, and mean DP values for each domain. (C) Structure superimposition between native structure (green) and best predicted model (blue, Das model 3).