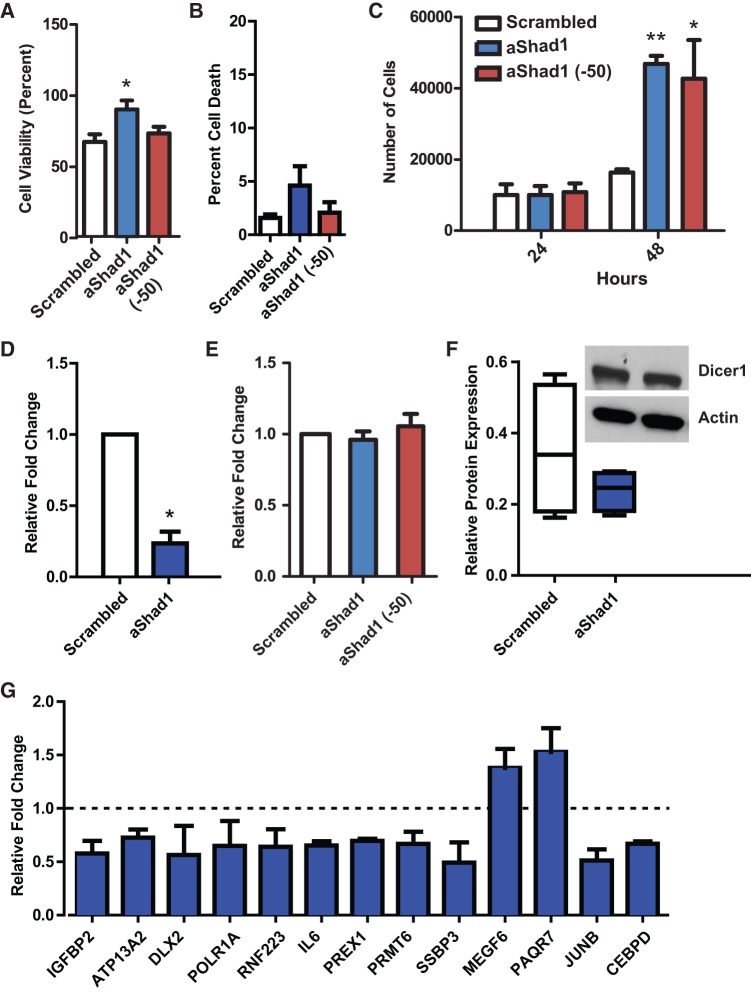
FIGURE 4.
Characterization of probable Shad1 function. (A) MTT assay of cells 48 h post-transfection. Percent cell viability is based on nontransfected cells plated at the same initial density. (*) P-value <0.05; n = 3. (B) Cytotoxicity assay shows no significant cell death upon Shad1 knockdown. (C) Cell counts of transfected cells at 24 and 48 h post-transfection. (*) P-value <0.05; (**) P-value <0.001; n = 3. (D) Transfection with LNA antisense to Shad1 (aShad1) shows a decrease in Shad1 expression compared with scrambled control. (*) P-value <0.05; n = 3. (E) Shad1 knockdown shows no difference in Dicer1 mRNA levels (P-value = 0.5002; n = 3). (F) Shad1 knockdown shows no difference in Dicer1 protein levels (P-value = 0.2907; n = 4). Representative Western blot illustrates band intensities used for quantitation (inset). (G) qPCR validation of genes differentially expressed upon Shad1 knockdown. All genes are significantly differentially expressed with P-values <0.05; n = 3. Dashed line represents no relative change; anything above is up-regulated and below is down-regulated.

