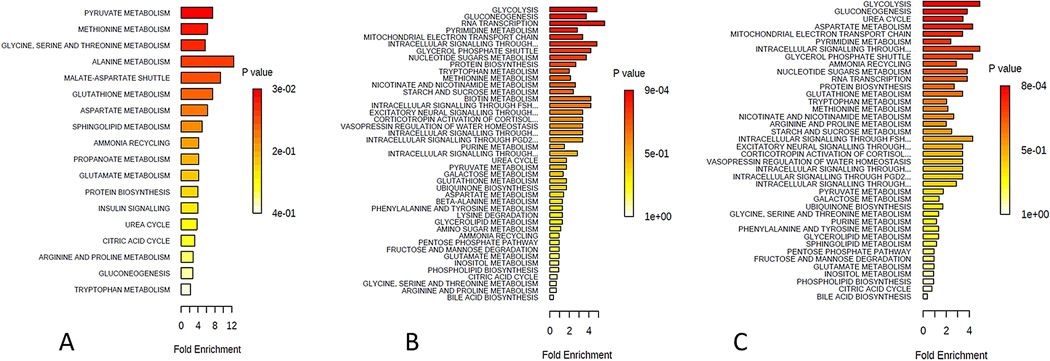
Figure 1.
Summary of pathway enrichment analysis for Group 1: Controls, Group 2: KCRGP, and Group 3: KC-no correction. Above is a display of the diversity of signaling pathways that are enriched on the basis of all the metabolites passing filtering criteria. The most significant p-values are in red while the least significant are in yellow and white. A) Predicted metabolic pathways affected in Group 1 B) predicted pathway regulation for Group 2, and C) Predicted metabolic pathways affected in Group 3.

