Figure 3.
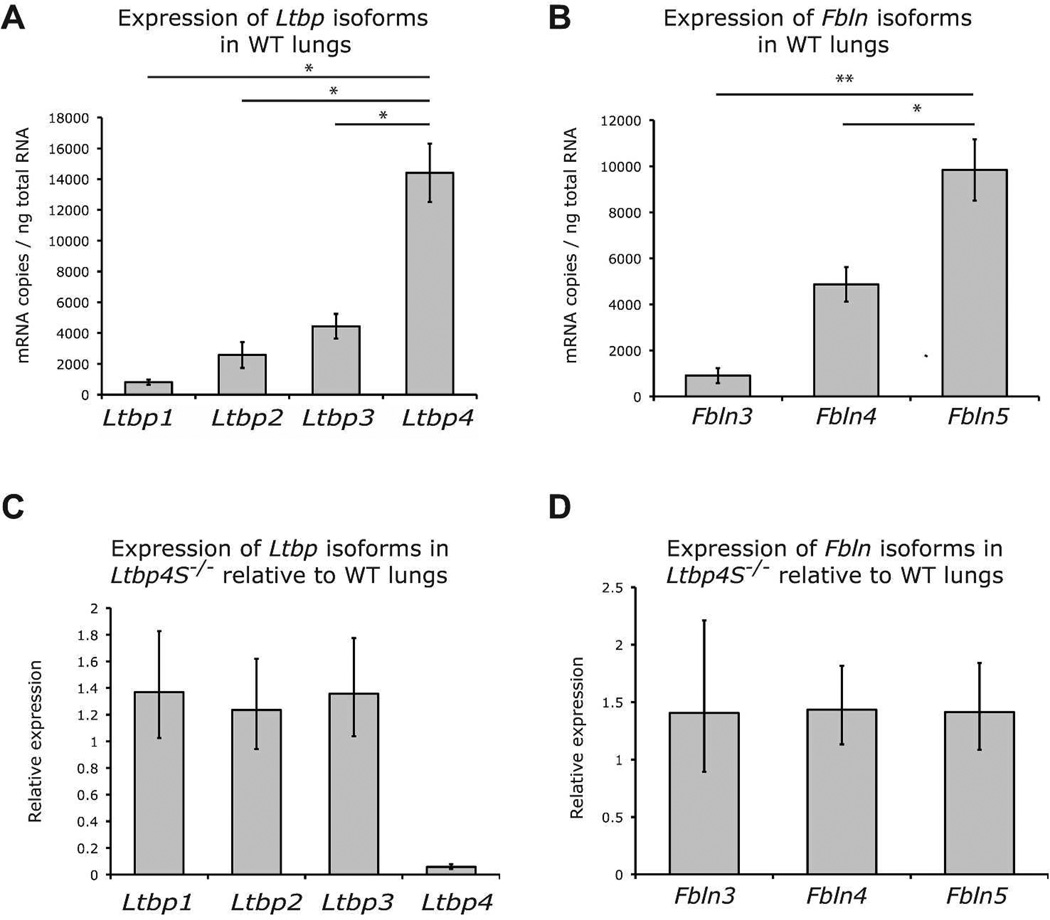
Expression of Ltbps and fibulins in WT and Ltbp4−/− lungs. A and B. Quantitative RT-PCR of Ltbps and fibulins in WT mouse lungs. A. Ltbp expression levels in P0.5 lungs. Ltbp4 is expressed at higher levels than Ltbp1, 2 and 3 in WT lungs. B. Fbln5 is expressed at higher levels than Fbln3 and 4 in WT lungs. C and D Semi-quantitative RT-PCR comparison of Ltbps and Fblns expression in WT and Ltbp4S−/− P0.5 mouse lungs. C. Ltbp1, 2 and 3 expression levels are equivalent in Ltbp4S−/− and WT lungs. D. Fbln3, 4 and 5 expression levels are similar in WT and Ltbp4S−/− lungs. Expression levels in C and D were standardized to expression levels of G3pdh. Three samples were analyzed per group. * P<0.05, ** P<0.01, determined by Student t-test.

