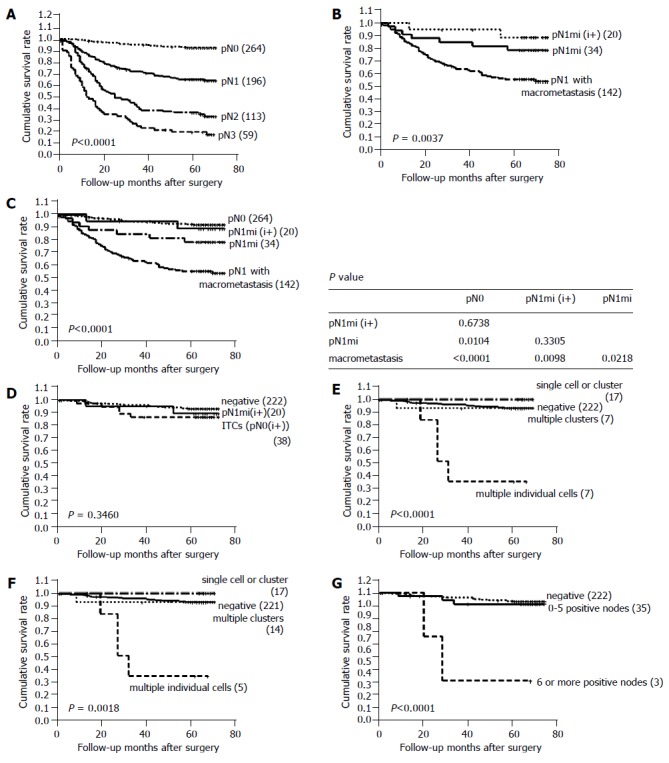
Figure 2.

Survival curves using the Kaplan-Meier method. A: Patient survival according to reclassified pN stage; B: survival curve of cases with pN1 with one or more macrometastases, pN1mi, and pN1mi(i+); C: survival curve of the cases with pN0 stage, pN1mi(i+), pN1mi, and pN1; D: prognostic impact of lymph node metastases as detected by immunostaining; E: survival curves according to the pattern of ITCs; F: survival curves according to the pattern of ITCs deleting patients with stage IV disease; G: survival curves according to the number of positive nodes.
