
Fig. 2.
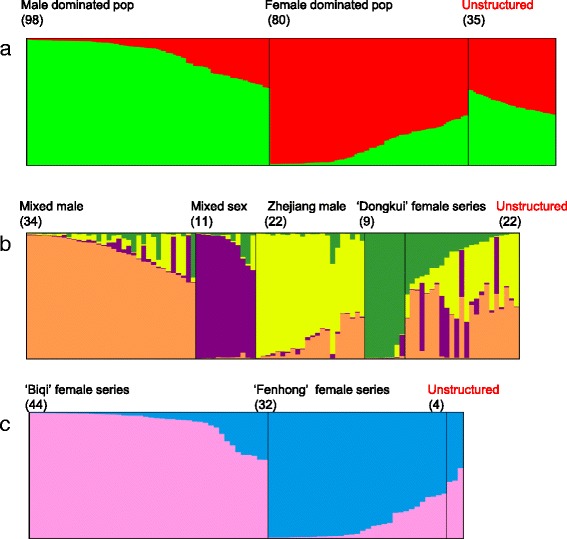
Population stratification based on Bayesian clustering approaches, with a value of k from 1 to 10. Each individual is shown as a thin vertical line, different subpopulations are in a different colour. The name of each population or subpopulation and the number of individuals included is given at the top of each column. a, The first STRUCTURE step with 213 accessions, k = 2. The subpopulation was displayed by DISTRUCT, and each subpopulation ordered according to the membership coefficient. b, Nest structure analysis for the Male Dominated pop. mainly divided into four subpopulations. c, Nest structure analysis for the Female Dominated pop. which was further divided into two subpopulations. Note: Unstructured indicates individuals which were not assigned to any population