
Fig. 3.
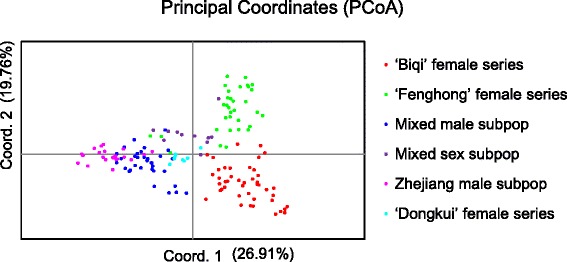
Principal coordinate analysis (PCoA) of 152 M. rubra accessions. The different colours represent the six subpopulations inferred by nest STRUCTURE analysis. The first and second principal coordinates account for 26.91 % and 19.76 % of the total variation, respectively