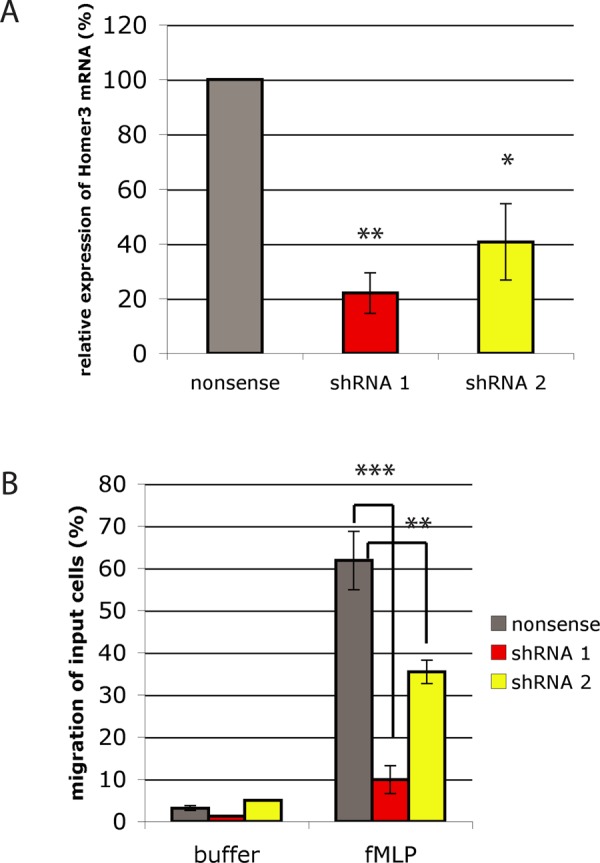
FIGURE 2:

Homer3 knockdown impairs HL-60 chemotaxis. (A) RNA was isolated from control cells (nonsense shRNA) and HL-60 cell lines expressing one of two different Homer3 shRNAs (shRNA 1 and shRNA 2). Relative expression of Homer3 was quantified by quantitative real-time PCR using GAPDH as a reference gene. Results represent the mean with SD of three replicates. (B) Migration of control or Homer3-knockdown differentiated HL-60 cells in response to 10 nM fMLP measured via Transwell chemotaxis chambers after 2 h. Results are a representative example of five independent experiments. *p < 0.05, **p < 0.005, ***p < 0.0005 by unpaired t test.
