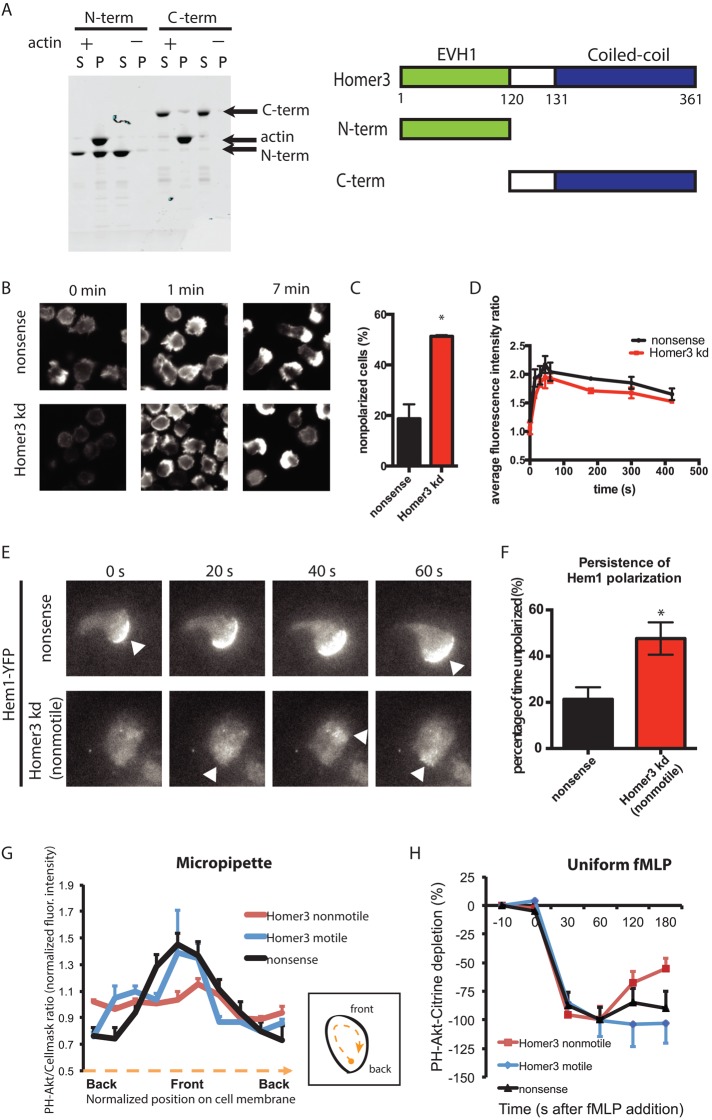
FIGURE 5:
Homer3 is an actin-binding protein necessary for persistent actin and PIP3 polarization. (A) A cosedimentation assay reveals that the N-terminal portion of Homer3 is necessary and sufficient to directly bind F-actin. Purified, bacterially expressed GST–N-terminal (N-term) and GST–C-terminal (C-term) fragments of Homer3 were incubated with (+) and without (–) F-actin and then centrifuged. Equal amounts of the supernatant (S) and pellet (P) fractions were separated by SDS–PAGE and stained with CBB. Arrows indicate C-term (53 kDa), actin (42 kDa), and N-term (40 kDa). Schematic of Homer3 and the truncated proteins. (B–D) Differentiated control (nonsense shRNA) or Homer3- knockdown HL-60 cells were stimulated in suspension with 10 nM fMLP. At the time points indicated, cells were fixed and stained with rhodamine-phalloidin to visualize F-actin. (B) Representative epifluorescence images before stimulation (0 min), at peak response (1 min), and after polarization (7 min). (C) Quantification of proportion of polarized cells at the 7-min time point for control (n = 577) and Homer3-knockdown (n = 754) cells. Results are the mean and SE of three independent experiments. Asterisk represents p < 0.05 by unpaired t test. (D) Average fluorescence intensity of the whole-cell population, as quantified by FACS, was measured and normalized to the unstimulated control population to correct for FACS and staining variation between experiments. Results are the mean and SE of three independent experiments. (E) Polarization of actin nucleation was assessed by TIRF imaging of a fluorescent component of the WAVE complex (Hem1-YFP) for cells exposed to uniform 100 nM fMLP in a squeeze chamber. Images are representative of at least 10 cells. Arrowheads indicate regions of increased Hem1 intensity. Corresponds to Supplemental Movies S4 and S5. (F) Persistence of Hem1-YFP polarization was quantified as described in Materials and Methods for nonsense (n = 5) and Homer3-knockdown (n = 6) cells. *p < 0.05 by unpaired t test. (G) Line-scan analysis of the ratio images shown in Supplemental Figure S4. Differentiated HL-60 cells (nonsense shRNA or Homer3 shRNA) expressing PH-Akt-Citrine and labeled with CellMask Orange were stimulated with fMLP released from a micropipette. The normalized ratio values between PH-Akt-Citrine and CellMask Orange within the cell periphery were calculated, with each cell normalized such that the average of all ratios along each cell edge is 1. The cell edge of each cell was divided into 10 angular sectors, and values were averaged within each angular sector. Internalized CellMask Orange vesicles were excluded from analysis. Error bars are SE (n = 5 for each line). The difference between nonsense and Homer3 knockdown (motile) is not significant by F test, whereas the difference between nonsense and Homer3 knockdown (nonmotile) is significant (p < 0.005) by F test. (H) Cytoplasmic depletion of PH-Akt-Citrine after addition of 100 nM fMLP. Normalized average fluorescence in a cytoplasmic region was measured at the time points indicated (100% is the maximum depletion in the control line). Error bars are SE (n = 10 for each line). No significant differences by t test.

