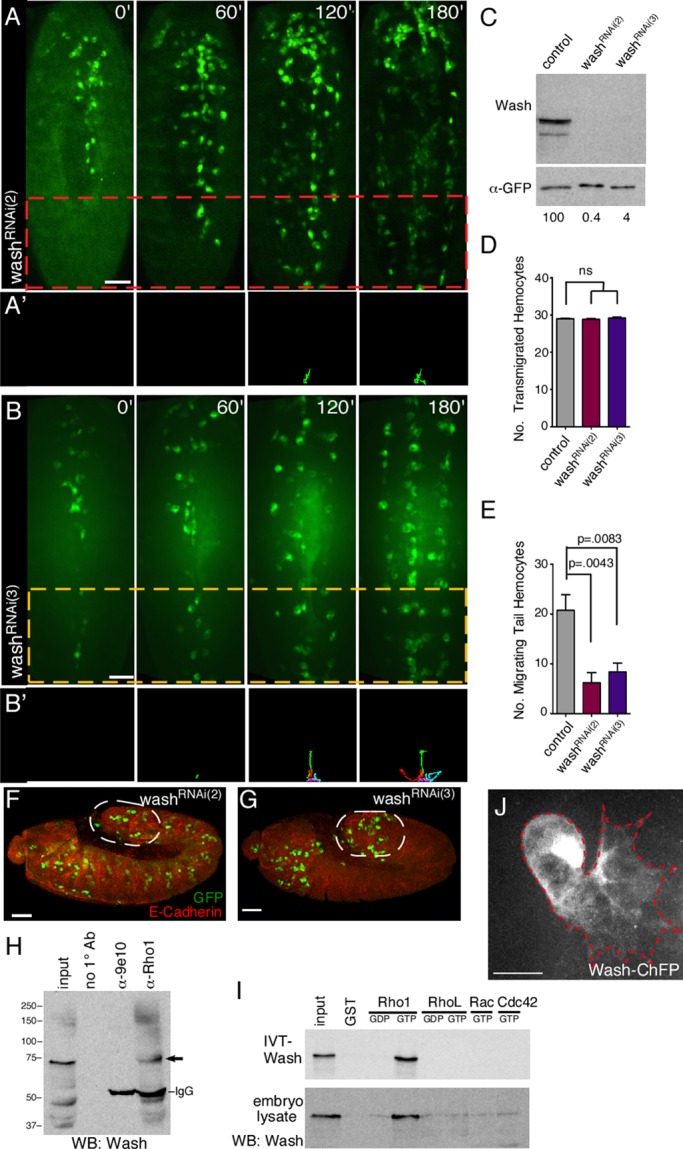
FIGURE 2:

Wash participates in a subset of hemocyte developmental migrations. (A–B′) Time-lapse series of ventral surface projections of washRNAi(2) (A, A′) and washRNAi(3) (B, B′) migrating hemocytes expressing GFP. Hemocytes that began their developmental migrations in the tail were tracked for 180 min (A′, B′). (C) Western analysis of protein extracts from control (Pxn-Gal4), washRNAi(2), and washRNAi(3) hemocytes probed with antibodies recognizing Wash (α-Wash(P3H3)) and a loading control (α-GFP). The normalized levels of Wash are indicated (with control set to 100). (D, E) Quantification of the number of transmigrated tail hemocytes (D) and number of these tail hemocytes that migrate anteriorly (E) in control (Pxn-Gal4), washRNAi(2), and washRNAi(3) embryos (n ≥ 20). (F, G) Confocal surface projection micrographs (lateral view) of stage 10 washRNAi(2) (F) and washRNAi(3) (G) embryos stained for DE-cadherin (red) and GFP (green). Transmigrated hemocytes are circled. (H) Western blot of immunoprecipitations (IPs) from Drosophila embryo extracts performed with no primary antibody, a nonspecific antibody (9e10), and Rho1 antibody (α-Rho1(P1D9)) and probed with antibodies recognizing Wash (α-Wash(P3H3); arrow). (I) GST pull-down assays with 35S-labeled, in vitro–translated, full-length Wash protein (IVT-Wash; top; Wash complex absent) or Drosophila embryo extracts (embryo lysate; bottom; Wash complex present) and GST alone or GST-Rho family GTPases loaded with GDP or GTP as indicated. A 5% input is shown. The resulting Western blot of the embryo lysate pull downs (bottom) was probed with antibodies recognizing Wash (α-Wash(P3H3)). (J) Confocal surface projection micrograph of an otherwise wild-type hemocyte expressing a Wash-ChFP fusion protein. All results are given as means ± SEM; p values are indicated. Scale bars, 40 μm (A, B, F, G), 10 μm (J).
