FIGURE 2:
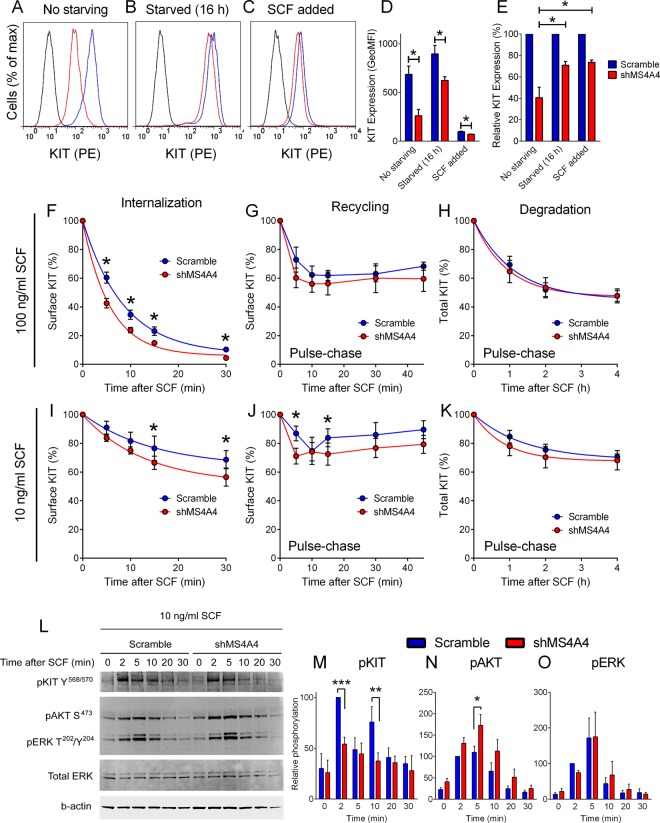
Silencing MS4A4 alters KIT internalization, recycling to the plasma membrane and signaling in LAD-2 cells. (A) Flow cytometry histogram showing surface KIT expression at day 7 postinfection with shMS4A4. (B) Flow cytometry histogram showing surface KIT expression after 16 h of SCF withdrawal. (C) As in B, but followed by stimulation with 100 ng/ml SCF for 1 h. Isotype, black; scramble, blue; shMS4A4, red). (D) Average flow cytometry data from SCF exposure experiments, Values are geometric mean fluorescence intensity (MFI; error bars, SEM; n = 3). (E) Average flow cytometry data calculated as percentage expression normalized to scramble control (error bars, SEM; n = 3). (F) Average flow cytometry data from KIT internalization assays after exposure to 100 ng/ml SCF. SCF was withdrawn for 16 h before experiment (n = 5, p = 0.0008, two-way ANOVA scramble vs. shMS4A4). *p < 0.05, Sidak's posttest. (G) KIT kinetics assay using SCF pulse chase with 100 ng/ml SCF. The x-axis is the time spent at 37°C during chase (n = 3). (H) KIT degradation assay using pulse chase with 100 ng/ml SCF in the presence of 10 μM cycloheximide and staining for surface and intracellular KIT. (I) As in F, after exposure to 10 ng/ml SCF. BFA was included to eliminate repopulation of surface KIT from newly synthesized pools (n = 4, p = 0.047, two-way ANOVA scramble vs. shMS4A4). *p < 0.05, Sidak's posttest. (J) KIT kinetics assay using pulse chase with 10 ng/ml SCF. The x-axis is the time spent at 37°C during chase (n = 3). *p < 0.05, Sidak's posttest. (K) KIT degradation assay by using pulse chase with 10 ng/ml SCF in the presence of 10 μM cycloheximide and staining for surface and intracellular KIT. (L) Immunoblots for pKIT Y568/570 (Invitrogen antibody), pAKT S473, and pERK T202Y204 in scramble shRNA control and shMS4A4- treated LAD-2 cells for the indicated time after stimulation with 10 ng/ml SCF. (M) Analysis of fluorescence intensity (LI-COR system) of phosphorylated KIT (M), AKT (N), and ERK (O) after correction against loading control normalized to percentage of scramble control at 2 min (mean + SEM, n = 5). *p < 0.05, **p < 0.01, ***p < 0.001, ANOVA with Sidak's posttest.

