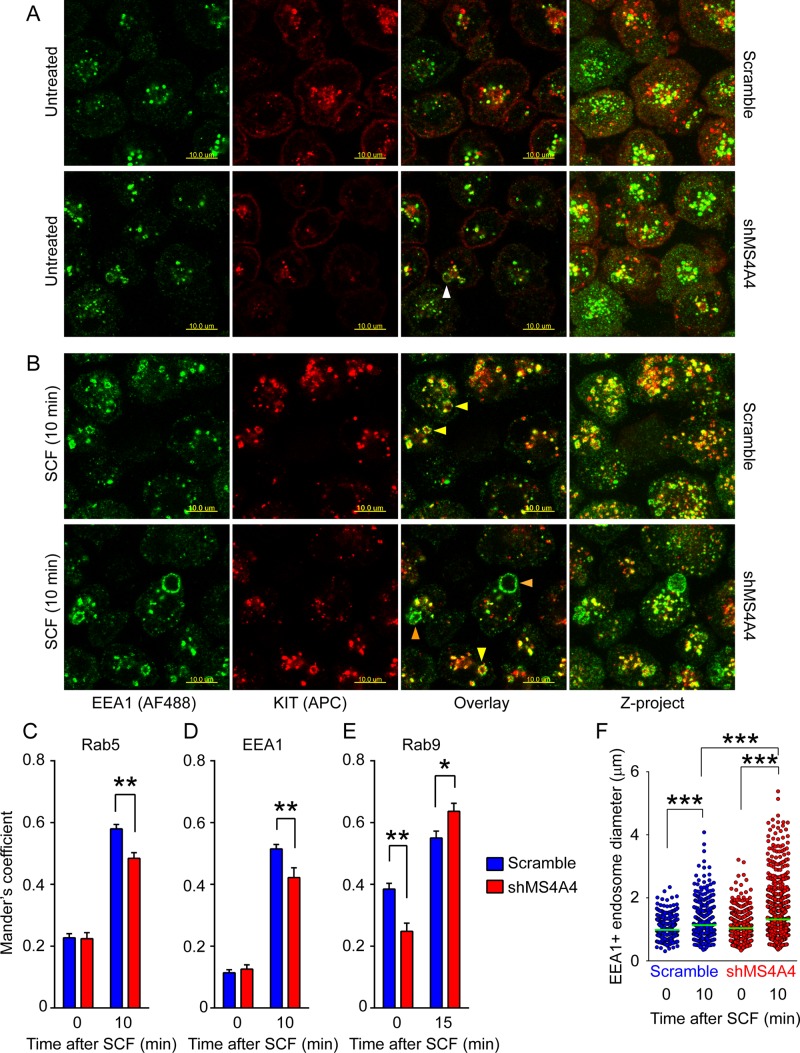
FIGURE 5:
Silencing MS4A4 alters endocytic KIT trafficking. (A) Immunofluorescence confocal microscopy of scramble shRNA–treated (top) and shMS4A4-treated (bottom) LAD-2 cells stained with rabbit anti-EEA1 (secondary AF488; green) and mouse anti-KIT (APC; red) in the absence of SCF. White arrowhead shows occasional enlarged endosomes in shMS4A4-treated cells. Right, superimposed z-projection of the stack of images. Scale bars, 10 μm. (B) Immunofluorescence confocal microscopy after stimulation with SCF for 10 min. Yellow arrowheads show enlarged endosomes positive for KIT. Orange arrowheads show very large endosomes in shMS4A4-treated cells that are negative for KIT immunofluorescence. Scale bars, 10 μm. (C–E). Manders coefficient of colocalization of KIT and Rab5 (C), KIT and EEA1 (D), and KIT and Rab9 (E) before and after stimulation with SCF. Scramble shRNA, blue bars; shMS4A4, red bars. (Bars are mean + SEM from the volume of 16 stacks of images from two separate experiments.) (F). Endosome size from the volume of image stacks calculated using Imaris software. Two observers obtained comparable measurements. Scramble shRNA, blue circles; shMS4A4, red circles. For C–F, *p < 0.05, **p < 0.01, ***p < 0.001, two-way ANOVA.

