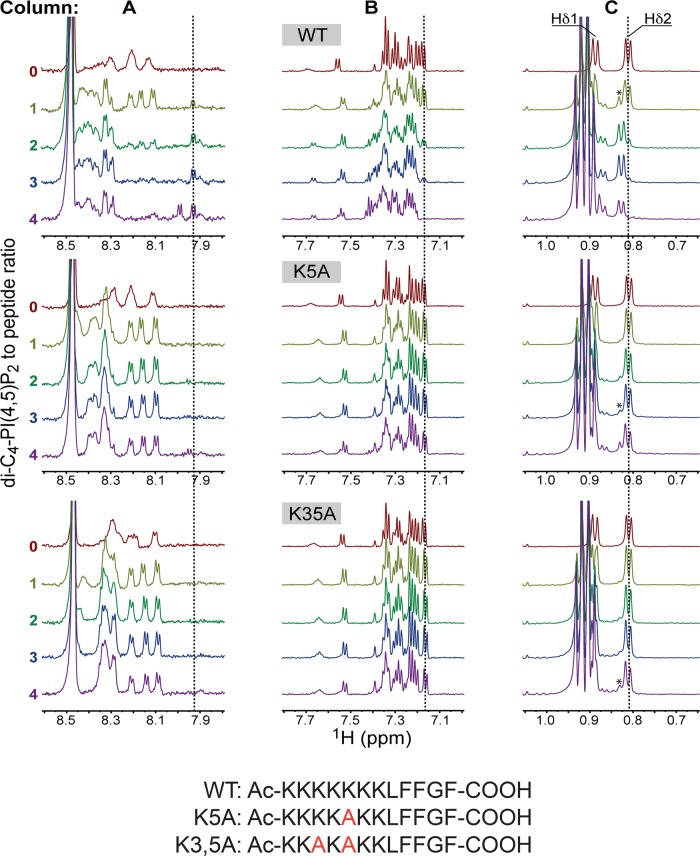
FIGURE 3:
NMR analyses of AtSfh1 nodulin peptide binding to PtdIns(4,5)P2. The 1H NMR spectra of three AtSfh1 nodulin peptide variants (peptide sequences given at bottom; Lys → Ala highlighted in red) are stacked and color coded according to di-C4-PtdIns(4,5)P2:peptide molar ratio. Three 1H spectral regions are shown: amide (A), aromatic (B), and upfield methyl (0.75–1.05 ppm; C). Significant chemical shift changes resulting from di-C4-PtdIns(4,5)P2 binding to nodulin peptide are marked (vertical lines). Peaks centered at 0.91 ppm correspond to methyl protons of di-C4-PtdIns(4,5)P2 acyl chains. The Leu Hδ peak of di-C4-PtdIns(4,5)P2-bound peptides is marked by an asterisk.

