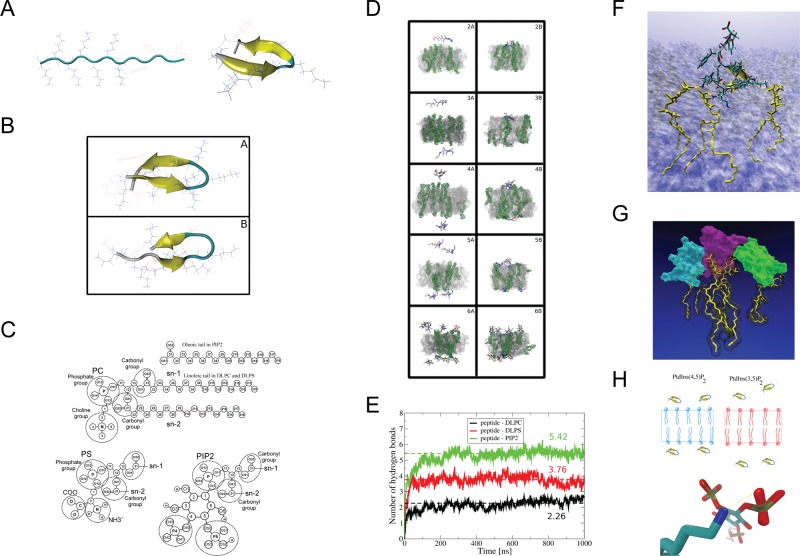
FIGURE 4:
Molecular dynamics simulations of AtSfh1 nodulin peptide on membrane bilayers. (A) Unfolded extended structure of the AtSfh1 nodulin peptide (left) and folded β-hairpin structure after 4 μs of MDS in water (right). (B) Two most-populated clustered structures from REMD simulation at 297 K: 10.85 (A) and 8% (B) probability. Both structures adopt β-hairpins. (C) Chemical structures of lipids used in the simulations. (D) Snapshots of systems simulated with a lipid bilayer. Beginning (A, C, E, G, I) and end of the simulation (B, D, F, H, J) of systems 2 (A, B), 3 (C, D), 4 (E, F), 5 (G, H), and 6 (I, J) in Supplemental Table S1A. PtdIns(4,5)P2 molecules are in green (H2O not shown). (E) Time development of peptide::lipid H bonds (DLPC, black; DLPS, red; and PtdIns(4,5)P2, green). Data averaged over simulations 2–6 in Supplemental Table S1A. Dashed lines show average level of H bonds with each lipid type. (F) Snapshot of the peptide (licorice representation together with “new cartoon”) bound to three PtdIns(4,5)P2 molecules (yellow licorice) by H bonds (orange dots). Membrane shown as a transparent surface (H2O not shown). (G) Snapshot of three aggregated nodulin peptides (cyan, violet, and green surface) bound to 3 PtdIns(4,5)P2 (yellow licorice). Picture generated by VMD (Humphrey et al., 1996). (H) Schematic representation of AtSfh1 nodulin peptide bound to PtdIns(4,5)P2 (blue) and PtdIns(3,5)P2 (red). Bottom, H bonds established between nodulin peptide Lys side chain (blue) and PtdIns(4,5)P2 (red).

