
Figure 3. LPCAT3 regulates PC arachidonate levels in vivo.
Lipidomics analyses were performed in various tissues of mice at E18.5. (A) Total PC amounts in tissues from wild type and LPCAT3-deficient mice. (B) Heat map showing the ratio of each PC species in LPCAT3-deficient mice. Each value is the average of ratio values (% of wild type) for tissues analyzed in (C–H). (C–G) The levels of the indicated PC species in wild type and LPCAT3-deficient mice were measured by LC-MS. (H) The levels of 16:0 LPC were measured in wild type and LPCAT3-deficient mice. Data were normalized to total MS signals shown in Figure 3—figure supplement 1. Prox.: Proximal; Dist.: Distal. (A, and C–H) Error bars are SEM (n = 5). *p < 0.05, **p < 0.01, ***p < 0.001, ****p < 0.0001. See also Figure 3—figure supplements 1, 2.

Figure 3—figure supplement 1. Total signals used for normalization of lipidomic profiling analysis.

Total MS signals from all the SRM channels of the lipidomic profiling analysis, which were used for normalization (n = 5). Note that the amount of spleen lipids analyzed was not normalized to tissue weight, making if difficult to compare the total values (see ‘Materials and methods’).
Figure 3—figure supplement 2. Metabolism of arachidonate.
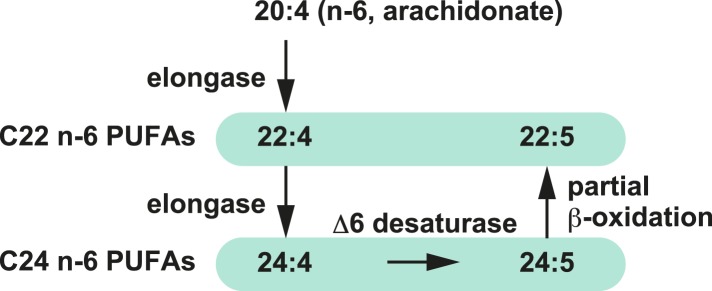
Metabolism of arachidonate (elongation, desaturation, and partial β-oxidation) that might have been enhanced due to the excess of arachidonoyl-CoA in LPCAT3-deficient mice.