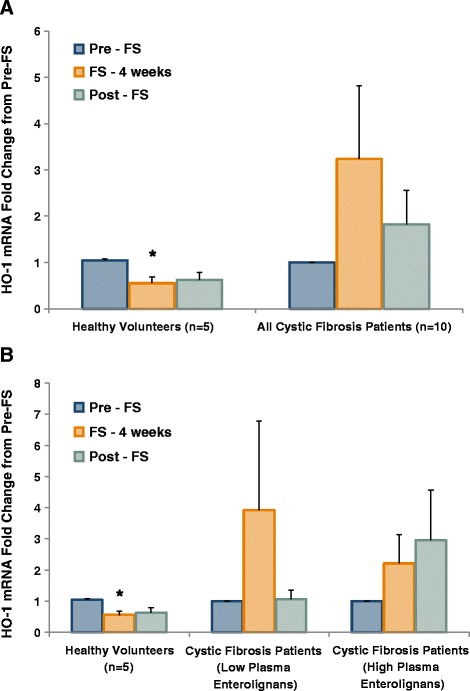
Figure 10.

FS Modifies Heme Oxygenase 1 Gene Expression in Buccal Epithelium. Buccal swabs were performed at week 0, 4, and 8 during the study. Buccal epithelial cells were harvested for RNA isolation and subsequent qPCR analysis. Antioxidant gene expression levels were determined using Taqman specific primers and probes to HO-1. Values are reported as fold change from pre-FS. Panel A displays comparison between healthy controls (n = 5) and all cystic fibrosis patients (n = 10). Panel B displays comparison between healthy controls (n = 5), cystic fibrosis patients with low lignans (n = 6), and cystic fibrosis patients with high lignans (n = 4). * signifies p < 0.05 for comparison between any time point in each respective cohort versus baseline (pre-FS).
