
Figure 3.
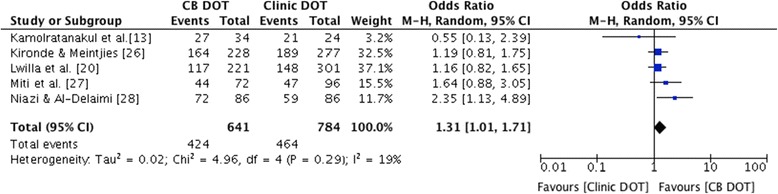
Forest plot of treatment success for CB DOT versus clinic DOT, prospective studies only. The size of the symbols is proportional to the number of patients included in the meta-analysis.
Official websites use .gov
A
.gov website belongs to an official
government organization in the United States.
Secure .gov websites use HTTPS
A lock (
) or https:// means you've safely
connected to the .gov website. Share sensitive
information only on official, secure websites.
Forest plot of treatment success for CB DOT versus clinic DOT, prospective studies only. The size of the symbols is proportional to the number of patients included in the meta-analysis.