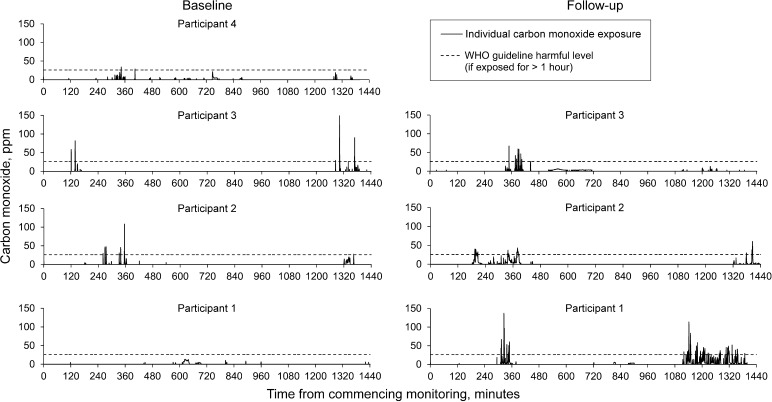
Figure 3.
Personal exposures to CO at baseline and at follow-up in four participants. These graphs show the detected level of ambient CO over two separate 24-h periods, measured by personal CO monitors (Lascar USB Dataloggers), which clipped to the clothes of four participants at baseline (left) and three participants at 7-day follow-up (right). A peak reading of 150 ppm was detected. The black dotted line indicates the level the WHO considers unsafe if exposed for >1 hour (26 ppm). WHO = World Health Organization; ppm = parts per million; CO = carbon monoxide.

