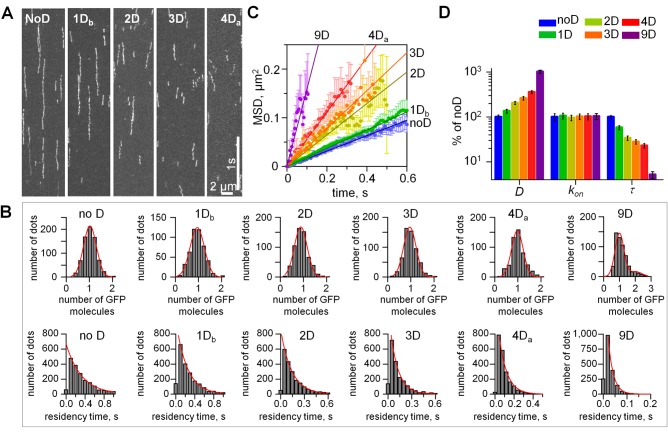
FIGURE 3:
Quantitative TIRF analysis of single NDC80 molecules on MTs. (A) Representative kymographs of NDC80 phosphomimetic mutants on MTs. Exposure time: 10 ms. Soluble protein concentration was 50 pM for all proteins. (B) Top row, histograms of the integrated intensities for NDC80-GFP dots on the coverslip-attached MTs, >300 dots for each mutant. Background was subtracted, and data were normalized to the number of GFP molecules. For all proteins, >95% of dots had the intensity of a single GFP (95% confidence); therefore our data reported in Figures 2 and 3 correspond to single NDC80 complexes. Red lines are Gaussian fits. Bottom row, histograms of residency times for individual NDC80 complexes (at least 2000 dots for each protein). Dissociation rates (koff) for different NDC80 mutants were determined from the exponential fits. (C) MSD vs. time; for each mutant protein the tracks from at least 600 individual NDC80 complexes were averaged; data based on at least two independent experiments for each protein. Symbols are experimental data; lines are linear fits; error bars are SEM. (D) Single-molecule parameters for NDC80 phosphomimetic mutants plotted on a logarithmic scale. Values for noD protein were taken as 100% (Table 1). For 1D and 4D proteins average values are plotted. Bars are mean ± SEM for number of independent experiments (N ≥ 2), in which n > 600 molecules were analyzed for each protein.

