FIGURE 4:
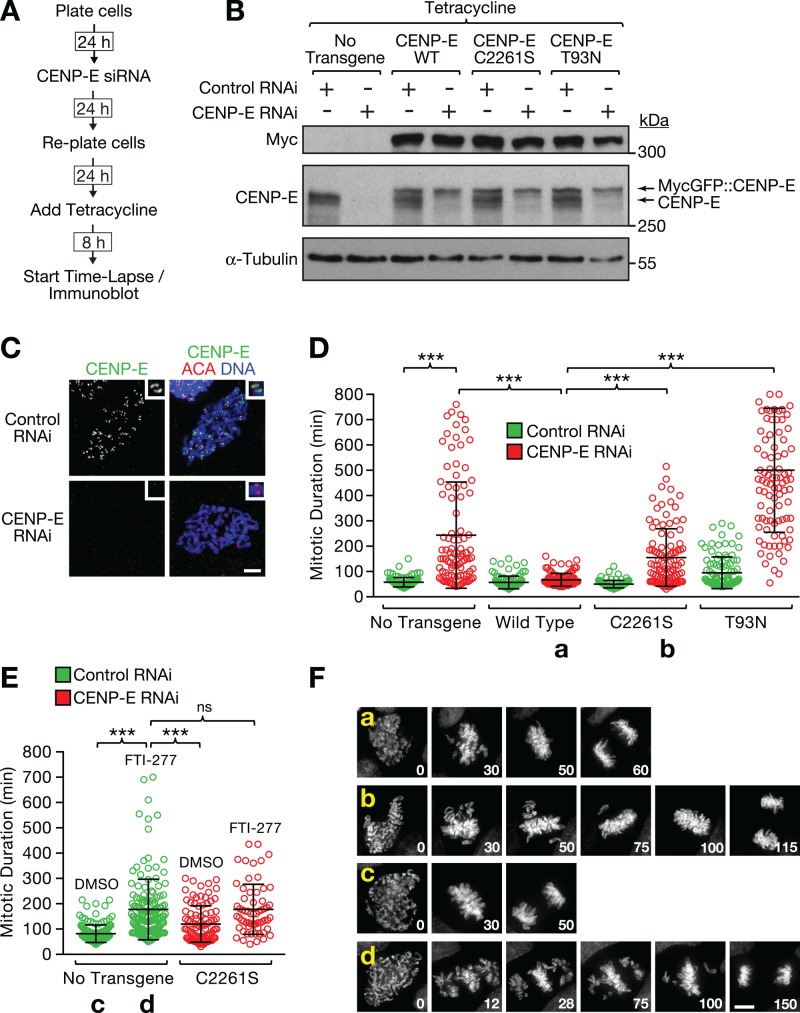
CENP-E farnesylation is important for chromosome segregation. (A) Experimental approach for the characterization of DLD-1 Flp-In T-Rex cells with integrated RNAi-resistant CENP-E constructs whose expression is inducible with tetracycline. (B) Immunoblot showing successful replacement of endogenous CENP-E with RNAi-resistant MycGFP::CENP-E in DLD-1 cells. C2261S corresponds to the CENP-E farnesylation mutant and T93N to motor-dead “rigor” CENP-E. α-Tubulin was used as a loading control. (C) Immunofluorescence of DLD-1 cells showing loss of kinetochore-localized CENP-E 48 h after transfection with CENP-E siRNA. Cells were costained with ACAs. Scale bar, 5 μm. (D) Quantification of mitotic duration (nuclear envelope breakdown to anaphase onset) from time-lapse fluorescence microscopy experiments conducted with DLD-1 cells expressing histone H2b::mRFP with or without the CENP-E transgenes described in B. Mitotic duration is shown as a scatter plot with the average and SD for the indicated experimental conditions. All conditions were filmed in parallel during the same imaging session using a multiwell chamber. One hundred cells were scored for each condition. The t test was used to determine statistical significance (***p < 0.0001). (E) Quantification of mitotic duration for the indicated conditions from a time-lapse experiment, as described in D (ns, not statistically significant). (F) Selected images from a time-lapse series of DLD-1 cells coexpressing histone H2b::mRFP and CENP-E transgenes showing chromosome congression defects in cells expressing nonfarnesylated CENP-E. Time is indicated in minutes relative to nuclear envelope breakdown (time point 0). Lowercase letters refer to the conditions labeled with the same letters in D and E. Scale bar, 5 μm.

