FIGURE 5:
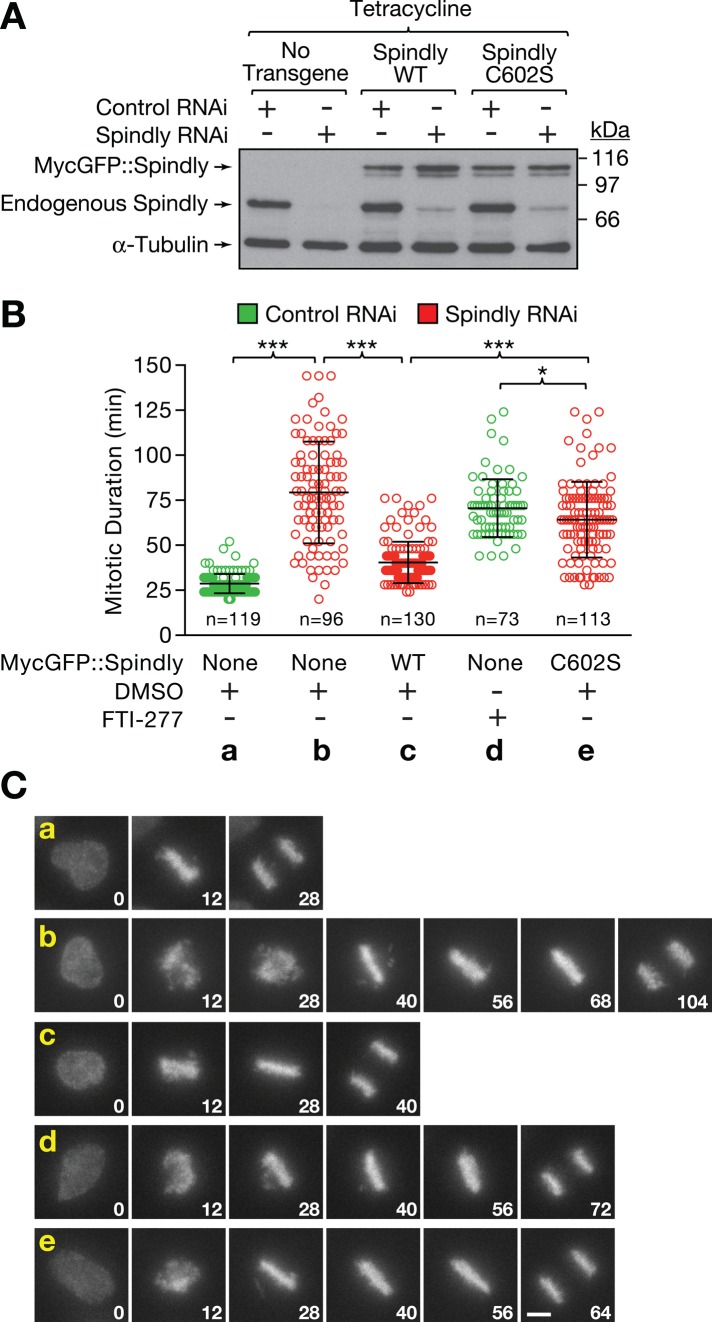
Preventing farnesylation of Spindly and inhibiting farnesyltransferase result in a similar mitotic delay. (A) Immunoblot showing expression levels of endogenous and RNAi-resistant, transgene-encoded MycGFP::Spindly. Cells were treated with control or Spindly siRNA for 22 h, followed by induction of transgene expression with 0.2 μg/ml tetracycline for 8 h. α-Tubulin was used as a loading control. (B) Quantitative analysis of mitotic duration (nuclear envelope breakdown to anaphase onset) for time-lapse fluorescence microscopy experiments performed with HeLa cells expressing histone H2b::mRFP with or without Spindly transgenes. RNAi and induction of transgene expression was performed as for the immunoblot in A. Data are shown as scatter plots with average and SD. Two independent experiments were performed for each condition, and the total number (n) of cells scored is indicated. The t test was used to determine statistical significance (***p < 0.0001; *p < 0.05). (C) Selected images from the time-lapse experiments described in B, showing chromosome congression defects in cells expressing the Spindly farnesylation mutant C602S. Time is indicated in minutes relative to nuclear envelope breakdown (time point 0). Scale bar, 5 μm.

