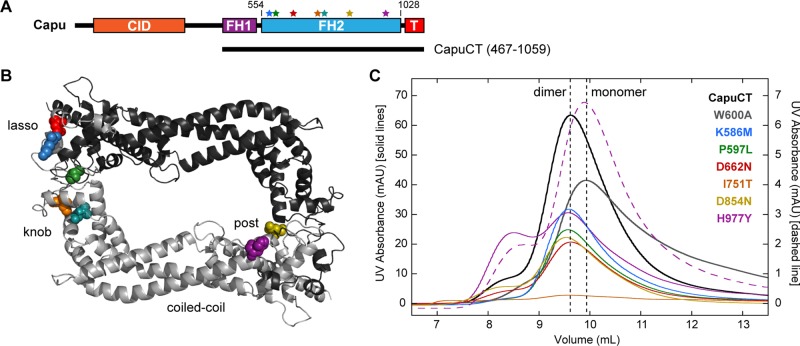
FIGURE 2:
Structural analysis of capu missense mutations. (A) Domain organization of Capu (1059 amino acids) and schematic of the C-terminal construct used in this study (CapuCT): CID, Capu inhibitory domain; FH1, formin homology 1; FH2, formin homology 2 (residues 554–1028); T, tail. Stars indicate the mutations, which are all located within Capu's FH2 domain. Residues are colored as in other images. (B) Locations of mutated residues within the FH2 domain based on a Capu homology model. The model was generated from the hDAAM1 crystal structure (Protein Data Bank # 2J1D; Lu et al., 2007) using SWISS-MODEL (Arnold et al., 2006). (C) Size exclusion chromatography of all mutants compared with wild-type CapuCT (dimer) and CapuCT-W600A (monomer) controls. The dashed purples line is the elution pattern from running the CapuCT-H977Y dimer peak a second time on the column.

