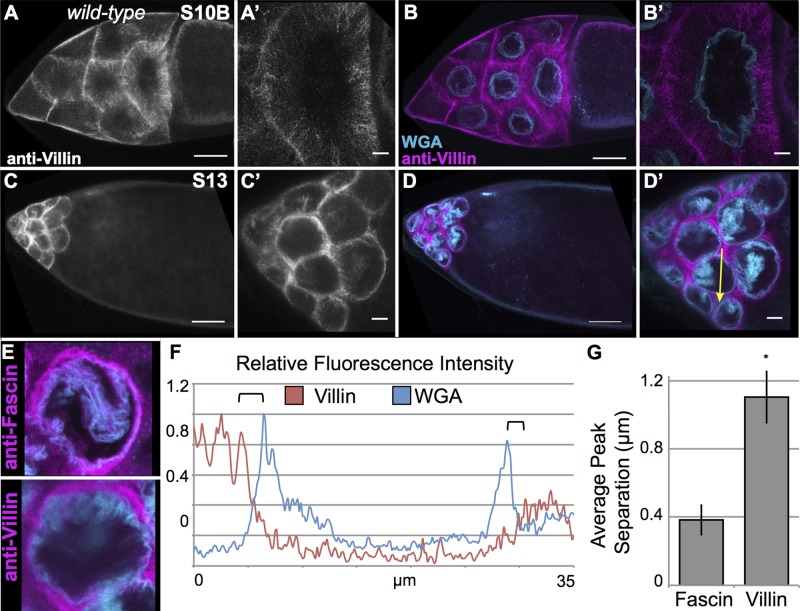
FIGURE 6:
Villin has a distinct localization pattern from Fascin. (A–D′) Maximum projections of three to five confocal slices of wild-type follicles imaged at 20× (A–D) or 63× (A′–D′). (A, A′, C, C′) Villin (white), (B, B′, D, D′) merged images: Villin (magenta) and WGA (cyan). Villin is primarily present on cytoplasmic actin bundles during S10B and is excluded from the nucleus (A–B′). During S13, Villin is in the remaining cytoplasm and not at the nuclear periphery (C–D′). Scale bars, 50 μm (A–D), 10 μm (A′–D′). (E) Maximum projections of three to five confocal slices of wild-type S13 follicles imaged at 63× and cropped to show a single nucleus. Top, follicle stained with anti-Fascin antibody (zoom-in of Figure 5A). Bottom, follicle stained with anti-Villin (zoom-in of D′). (F) Fluorescence intensity plot of Villin (red line) and WGA (blue line) along the yellow arrows in D′. x-axis, distance; y-axis, RFI, fluorescence intensity normalized to the brightest point along the plot. Black brackets mark the nuclear envelope (based on WGA peaks) and nearest peak cytoplasmic Villin intensity. (G) Graph showing average peak separation between either Fascin or Villin and WGA. Villin localization during S13 is clearly distinct from the perinuclear localization of Fascin. *p = 0.00029 compared with wild-type using paired t tests, unequal variance.

