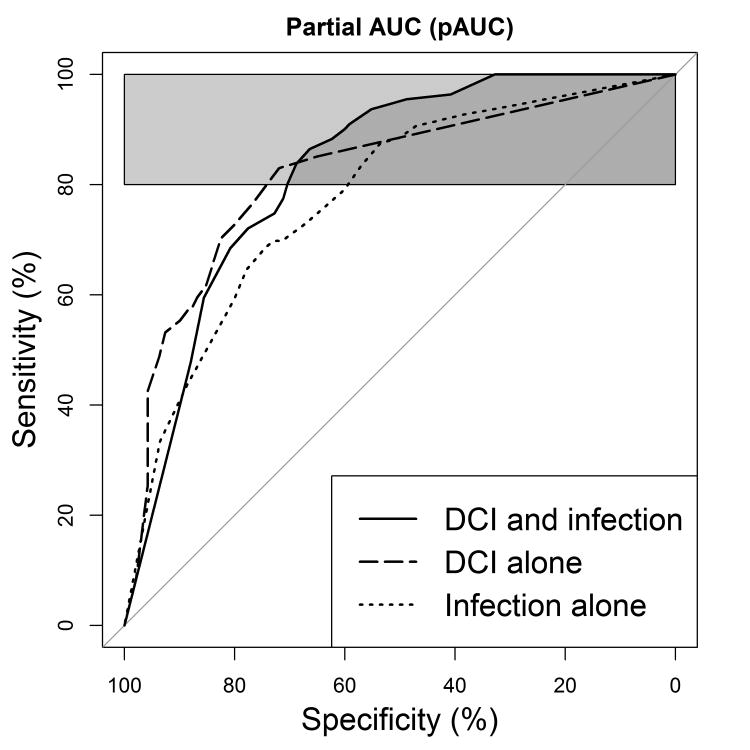
Figure 1.
Receiver operating characteristic curves of the predictive models. Depicts 80%-100% partial AUC for combined DCI and infection model (pAUC = 76.3%) versus infection alone (66.9%) and DCI alone (68.0%). The combined model was significantly more sensitive than the infection alone model (P=0.017) and DCI alone (P=0.004) models. Infection alone was not significantly more sensitive than the DCI alone model (P=0.734).

