
Fig. 5.
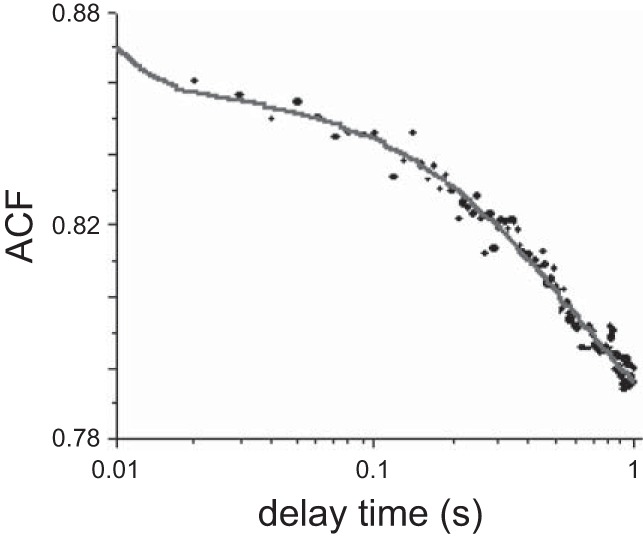
A representative trace of a normalized autocorrelation function (ACF) of polarization of fluorescence of contracting myofibril prepared from the left ventricle of Tg-WT mouse. Symbols are experimental data, and a gray line is the fit to equation shown in Ref. 36. The results of each experiment are presented in Table 4. The fact that ACF decays to a value >0 is due to the fact that mean polarization was nonzero.