
Fig. 4.
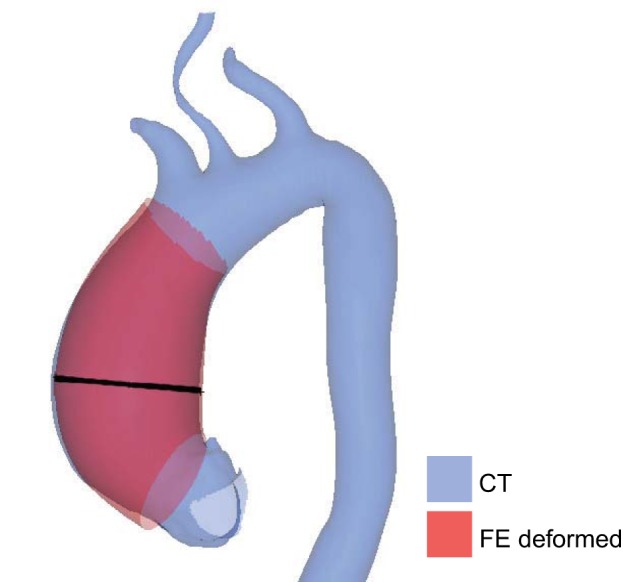
Overlay of the FE deformed AsAA geometry under systolic pressurization and the original systolic AsAA surface geometry segmented from the CT data showing good correspondence. The black line indicates the location of the maximum AsAA diameter measurement.