Fig. 2.
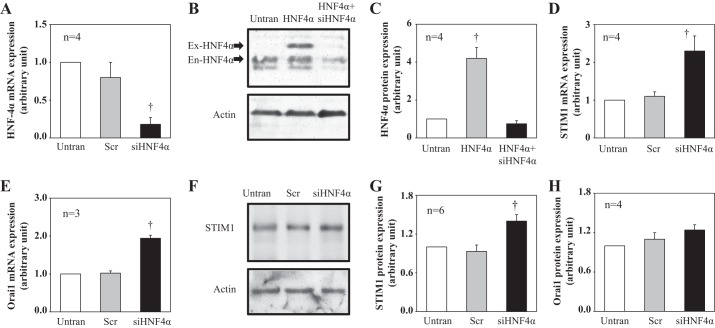
Effect of knocking down HNF-4α on stromal interacting molecule (STIM)1 and Orai1 expression levels in human MCs. A, D, and E: quantitative real-time RT-PCR showing mRNA expression levels of HNF4α (A), STIM1 (D), and Orai1 (E) in cultured human MCs without transfection (Untran) and transfected with scrambled small interfering (si)RNA (Scr) or siRNA against human HNF4α (siHNF4α). Cells were harvested 3 days after transfection. Expression levels of HNF4α and STIM1 mRNA in Scr and siHNF4α cells were normalized to Untran cells. †P < 0.05 compared with both Untran and Scr. n is the number of independent experiments. B and C: Western blots in human embryonic kidney (HEK)-293 cells showing HNF4α protein expression in HEK-293 cells without transfection (Untran), transfected with HNF4α expression plasmid (HNF4α), and cotransfected with HNF4α expression plasmid with siHNF4α (HNF4α + siHNF4α). B: representative blot. Actin was used as a loading control. Both transfected HNF4α (Ex-HNF4α) and endogenous HNF4α (En-HNF4α) are indicated by arrows. C: summary data. HNF4α expression levels in HNF4α and HNF4α + siHNF4α cells were normalized to Untran cells. †P < 0.05 compared with both Untran and HNF4α + siHNF4α cells. n is the number of independent experiments. F–H: Western blot analysis showing STIM1 (F and G) and Orai1 (H) protein expression in human MCs without transfection (Untran) or transfected with scrambled siRNA (Scr) or siRNA against human HNF4α (siHNF4α). F: representative Western blot of STIM1. Actin was used as a loading control. G and H: summary data. STIM1 and Orai1 expression levels in Scr and siHNF4α cells were normalized to Untran cells. †P < 0.05 compared with both Untran and Scr cells. n is the number of independent experiments.

