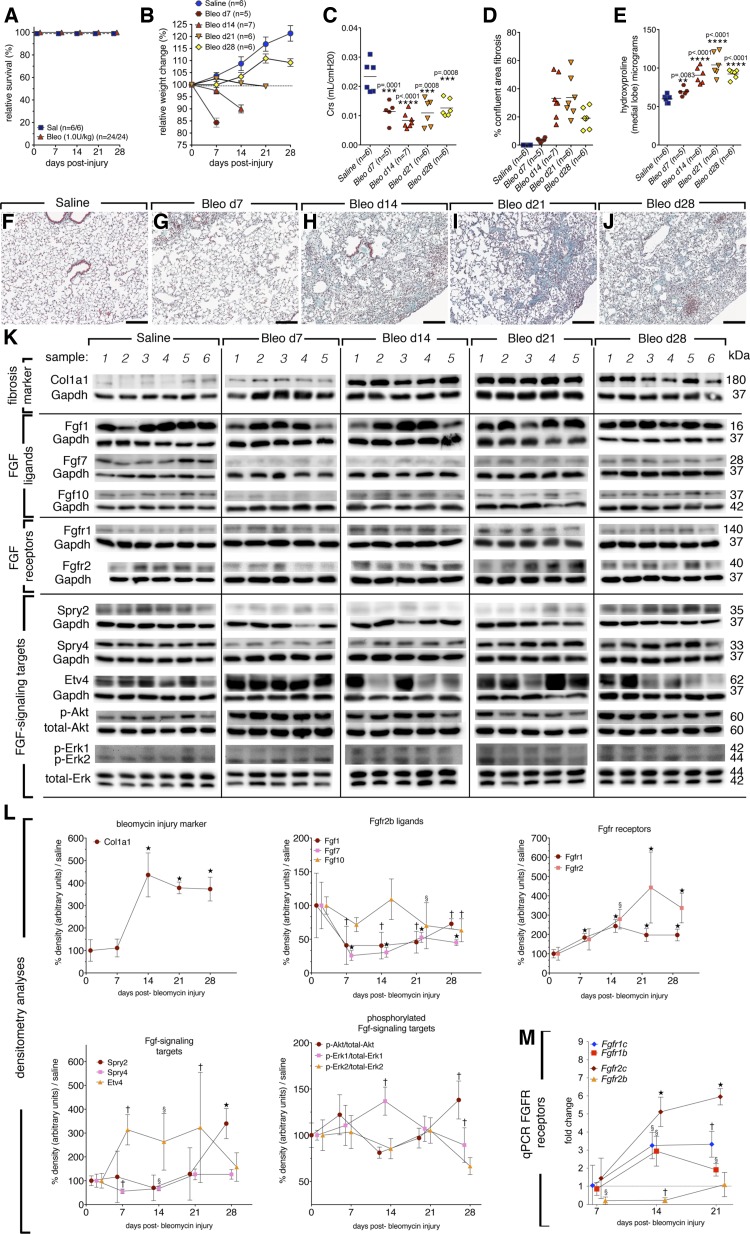
Fig. 1.
Fibrosis injury (1 U/kg) peaked between 14 and 21 days postinjury (dpi) in CD1 female, wild-type mice, moderate recruitment of Fgfr2b signaling following injury (Fgfs). A: survival curve. B: relative weight change. C: compliance. D: quantification of confluent fibrotic areas in hematoxylin and eosin (H/E) stains of left lobes. E: hydroxyproline content of medial lobes. F–J: Masson's trichrome stain of representative time points following injury. K: Western blots for Fgf-signaling pathway members of saline or bleomycin-treated mice. L: quantification of blot densities normalized to saline controls (gene of interest divided by control gene) and represented as percent of saline expression. M: since the Western blot antibodies used do not distinguish between receptor isoforms, qPCR was performed on epithelial (b-isoforms) and mesenchymal c-isoforms of Fgfr1 and Fgfr2 receptor. Already at 7 dpi, Fgfr2b was significantly reduced and remained so until 21 dpi. At 14 dpi, c-isoforms of both receptors were increased, as well as Fgfr1b. The c-isoforms remained elevated at 21 dpi, while Fgfr1b returned to saline levels. One-way ANOVA was performed against control values and error bars represent 95% confidence intervals; §P < 0.05; †P < 0.005; ⋆P < 0.0001. Scale bars: 100 μm.

