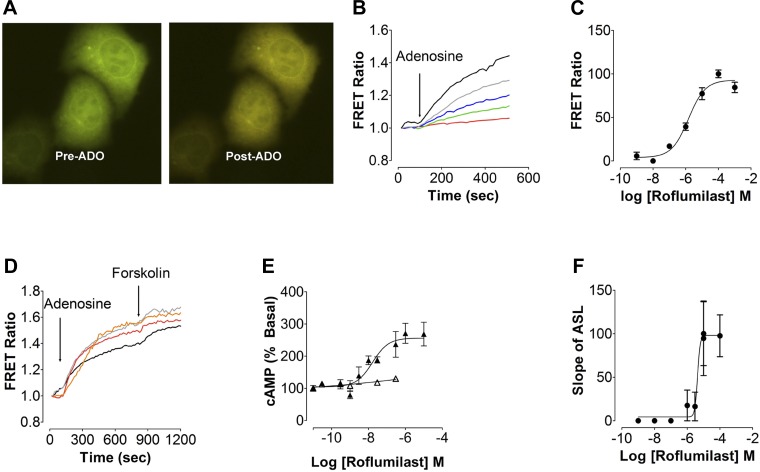
Fig. 1.
Roflumilast potentiates adenosine-stimulated cAMP signaling. A: overlay images of cyan fluorescent protein and yellow fluorescent protein fluorescence from HEK293T cells expressing indicator of cAMP using Epac2 (ICUE2) before and after adenosine (ADO) exposure. B: typical changes in Förster resonance energy transfer (FRET) ratio in HEK293T cells transfected with the ICUE2 FRET sensor with 1 μM ADO and varying amounts of roflumilast. Red, cells alone; green, 0.01 μM roflumilast + ADO; blue, 1 μM + ADO; gray, 10 μM roflumilast + ADO; black, 1,000 μM roflumilast + ADO. C: roflumilast dose-response curve generated using FRET ratio in HEK293T cells transfected with the ICUE2 FRET sensor and stimulated with 1 μM ADO and varying amounts of roflumilast. D: mean change in ICUE2 FRET ratio in HEK293T cells exposed to varying amounts of ADO or forskolin and roflumilast. Black, 1 μM ADO + 10 μM forskolin; gray, roflumilast + 1 μM ADO + 10 μM forskolin; red, 10 μM ADO + 10 μM forskolin; orange, roflumilast + 10 μM ADO + 10 μM forskolin. E: intracellular cAMP levels (% above basal) measured by ELISA in Calu-3 cells following increased amounts of serosal roflumilast ± 0.5 μM mucosal ADO; △, roflumilast; ▲, roflumilast + ADO. F: dose response to roflumilast generated by measuring the rate of airway-surface liquid (ASL) secretion in human bronchial epithelial cultures (HBECs) following serosal exposure to roflumilast (30 min) and apical exposure to ADO; n = 9–12.

