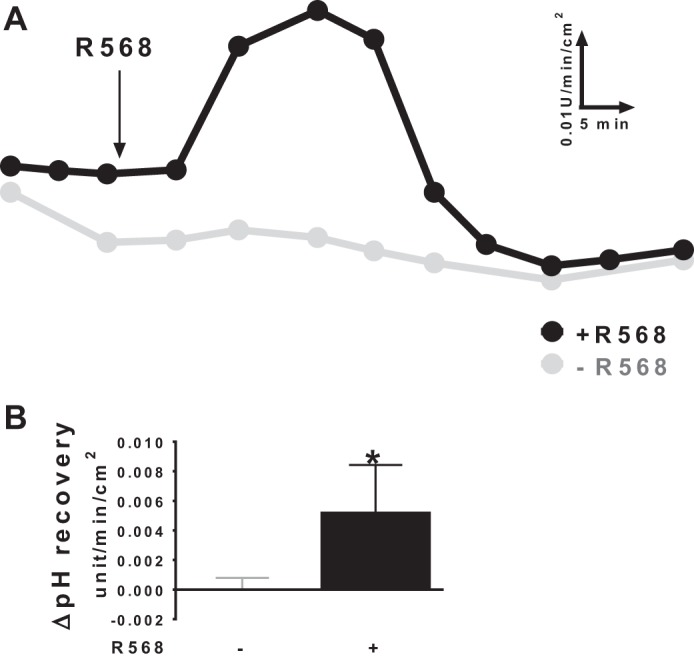
Fig. 2.

Effect of CaSR agonist R568 on acid-induced HCO3− secretion. A: representatives of pH recovery responses in the presence vs. absence of R568 (10 μM, serosa). The addition of R568 is shown as indicated. B: summary of ΔpH recovery rates (stimulated peak values above basal levels before additions of R568 or vehicle). Basal levels of acid-induced pH recovery were 0.015 ± 0.001 pH U·min−1·cm−2. The tissue resistance (Ω/cm2) and Isc (μeq·h−1·cm−2) at the end of 60-min experiments were 50 ± 12 and 1.74 ± 0.20 without challenge and 46 ± 10 and 1.97 ± 0.23 with acid challenges (P > 0.05). Data are means ± SE of 5 experiments. *P < 0.05 vs. control (with no R568).
