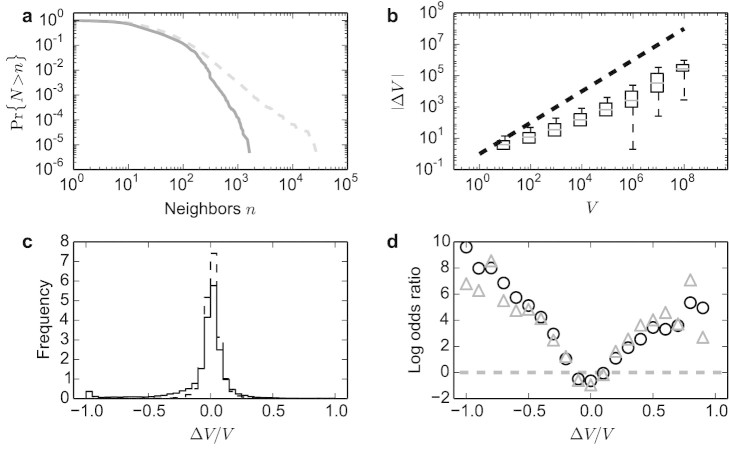
Figure 2. Traffic bursts concomitant with creation of new articles differ from normal traffic patterns.
(a), Cumulative distribution of neighborhood size for articles created in 2012 (solid), and pre-existing 2012 (dashed). Neighbors are all articles linking to or from the focal page. Older articles tend to have larger neighborhoods. (b), Absolute infra-week traffic change |ΔV| as a function of total traffic volume V for articles created in 2012. Even though some topics may receive hundreds of million visits, the change in traffic volume is on average much smaller. Pre-existing pages show a very similar pattern. Boxes stretch from the first to the third quartile, and whiskers represent the 99% confidence interval. Gray segments within boxes indicate the median. The dashed line is a guide to the eye for linear scaling. (c), Distribution of the relative change in traffic volume for 2012 (solid) and pre-existing (dashed) pages. (d), Log odds ratio comparing pages created in 2012 versus existing pages as a function of relative traffic change, for the whole sample (circles), and for a sub-sample of 16,816 pages (18%) with V > 2 × 10⁵ visits (triangles). The dashed gray line indicates equal odds.

