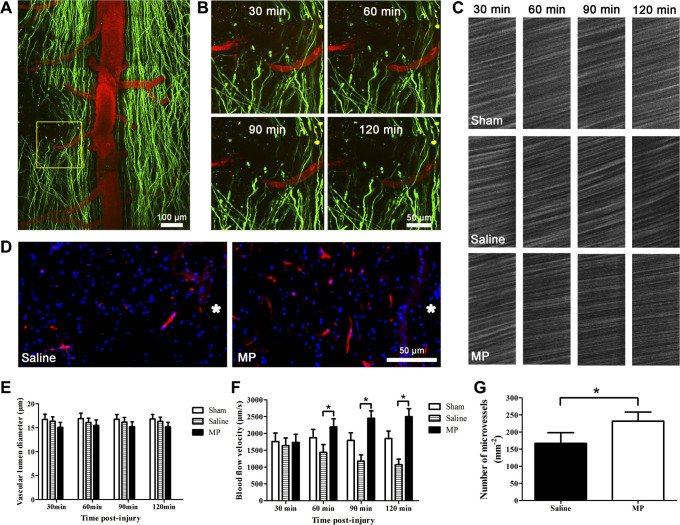
Figure 3. MP increased regional microvascular blood flow and reduced microvessel loss after SCI.
(A) Representative image showing axons (green) and blood vessels (red) after hemisection SCI. The yellow square denotes: the monitored microvessel at the edge of lesion site. (B) In vivo two-photon imaging of a microvessel proximal to the lesion site at 30 min, 60 min, 90 min and 120 min post-injury. (C) In vivo two-photon imaging of regional microvascular blood flow from the sham group, saline-treated SCI group and the MP-treated SCI group at 30 min, 60 min, 90 min and 120 min post-injury. (D) Representative images depict blood vessels (red) at the edge of lesion sites in saline-treated group and MP-treated group. Nuclei were stained with DAPI (blue). Asterisk indicates lesion site. (E) Changes of vascular lumen diameter in the sham group (n = 6), saline-treated group (n = 6), and MP-treated group (n = 6) at 30 min, 60 min, 90 min and 120 min post-injury. P > 0.05. (F) Changes of microvascular blood flow velocity in the sham group (n = 6), saline-treated group (n = 6), and MP-treated group (n = 6) at 30 min, 60 min, 90 min and 120 min post-injury. Values presented are mean ± SEM. *P < 0.01. Repeated measure ANOVA followed by Fisher's LSD. (G) The number of microvessels at the edge of lesion site in saline-treated (n = 6) and MP-treated (n = 6) mice. Values presented are mean ± SEM. *P < 0.01. Student's t test.

