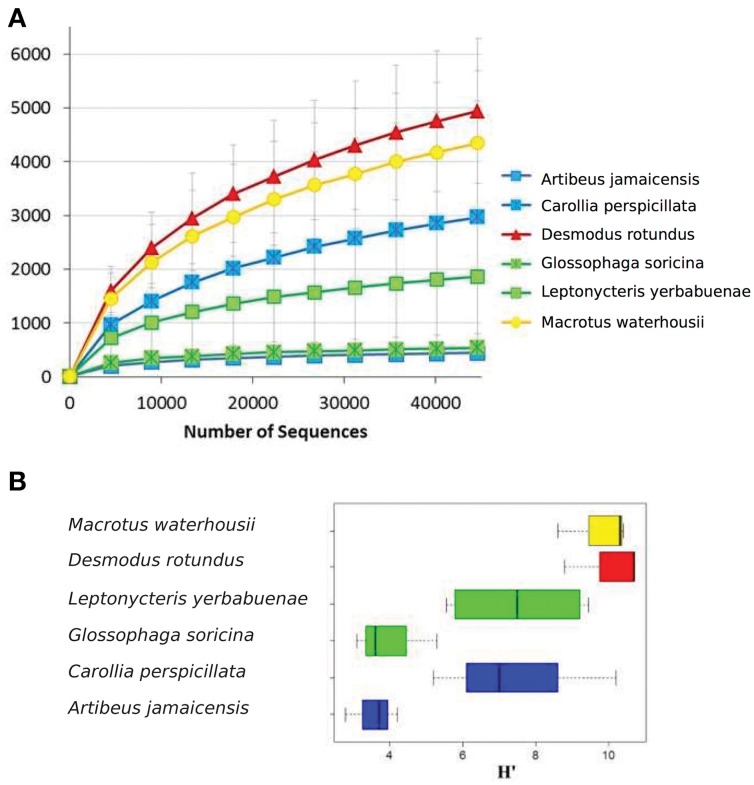
Figure 1.
(A) Rarefaction curves for OTUs defined at 97% similarity per bat specie. (B) Shannon diversity index for microbiome genetic composition based on 16S rRNA gene sequences. In both figures, error bars represent the standard variation observed between different individuals. Colors represent feeding strategies where blue-fruit eaters, green-nectar eaters, red-sanguivore and yellow-insect eater.

