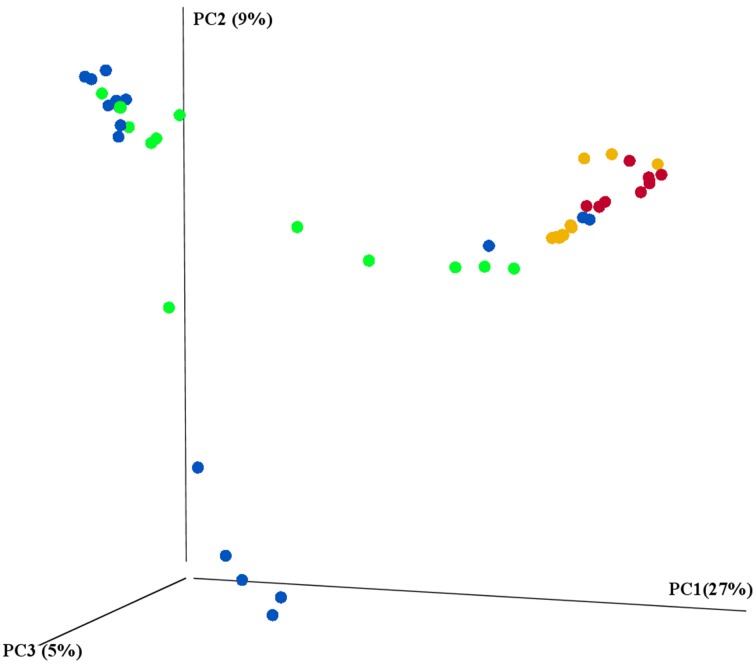
Figure 4.
16S rRNA gene sequencing revealed the differences between prokaryotic diversity of animal-based and plant-based strategists. Samples were clustered using principal coordinates (PC) analysis of the weighted UniFrac distance matrix. Each circle represents an individual intestinal region per bat where feeding strategies were colored to represent: blue-fruit eaters, green-nectar eaters, red-sanguivore and yellow-insect eater. Significant contributions of bat-traits to observed differences in prokaryotic diversity was tested using adonis and reported in Table 2.

