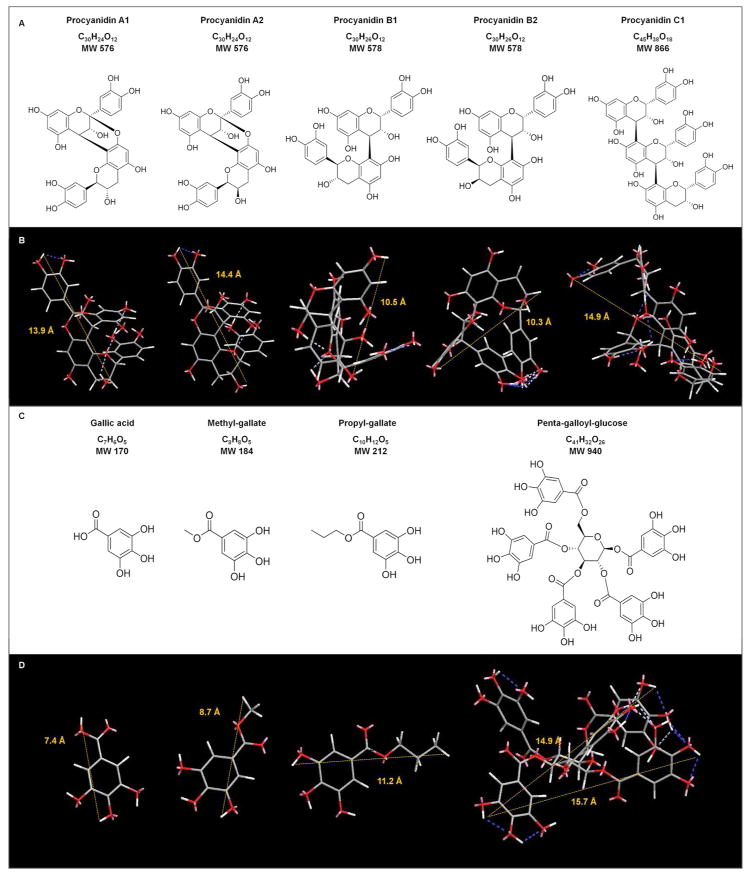
Figure 2.
Chemical structure, formulae, and molecular weights of naturally occurring phenolic compounds used in this study. Two and three dimensional models for PACs (A and B) and gallic acid and its derivatives (C and D) were performed using Chem3D Pro of ChemBioDraw® package (ver. 13.0.2, PerkinElmer, Waltham, MA, USA). The distance between two hydrogen atoms was determined with MM2 function during the molecular dynamics calculation for each molecule in angstroms (Å). The dynamic ranges for the compounds were: between 13.5 and 14.1 Å for A1, 13.9 and 15.1 Å for A2, 9.5 and 10.9 Å for B1, 10.0 and 11.2 Å for B2, 12.8 and 18.2 Å for C1, 7.1 and 7.7 Å for Ga, 8.1 and 8.9 Å for MGa, 10.8 and 11.4 Å for PGa, and 14.9 and 18.0 Å for PGG (β-D-glucose conformation confirmed by NMR). The mean distances for each compound are shown in B and D. The minimize Energy for each molecule were −17.32 Kcal/mol for A1, −15.40 Kcal/mol for A2, −28.66 kcal/mol for B1, −33.69 Kcal/mol for B2, −43.66 Kcal/mol for C1, −10.76 Kcal/mol for Ga, −1.88 Kcal/mol for MGa, −0.68 Kcal/mol for PGa, and −25.01 Kcal/mol for PGG. Calculations were done using the following parameters: intervals of step and frame were set as 2.0 fs and 10 fs, respectively; iteration was stopped after 10000 steps, rate of heating/cooling was set as 0.1 Kcal/atom/ps; and target temperature of 300 Kelvin. Blue and white dashed lines indicate intra-molecular hydrogen bonds. The high intensity in blue color represents less than ideal geometry.

