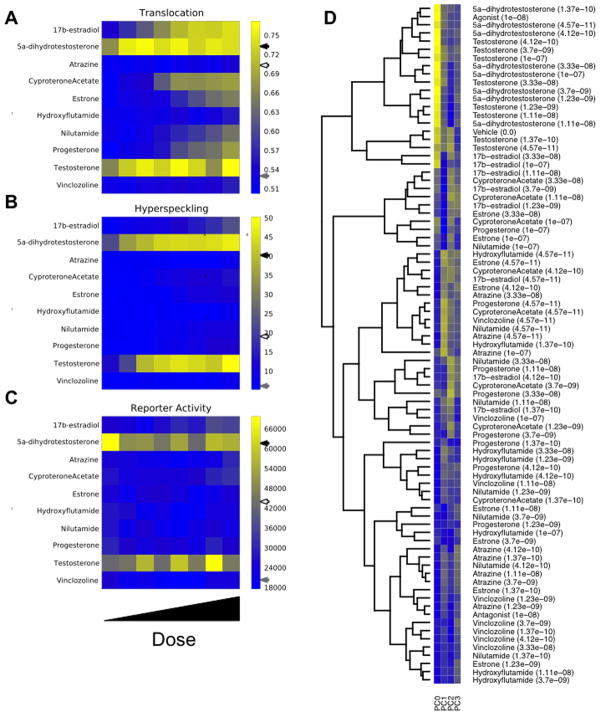
Figure 5.
Example data generated from exposure of the AR biosensor cell line to a group of AR effectors. Dose response data is depicted for the 3 central measurements: A) nuclear AR/cellular AR, B) nuclear hyperspeckling, and C) ARR2PB-dsREDskl activity. Note that agonist, antagonist, and vehicle treatments are denoted on the color bars by black, gray, and white arrows, respectively. D) Hierarchical cluster analysis and associated heat map responses of image-derived features over the dose regime of the 10 compounds in the experimental design. Four PCA features (PC0, PC1, PC2, PC3) capture 80% of the dataset variance.

