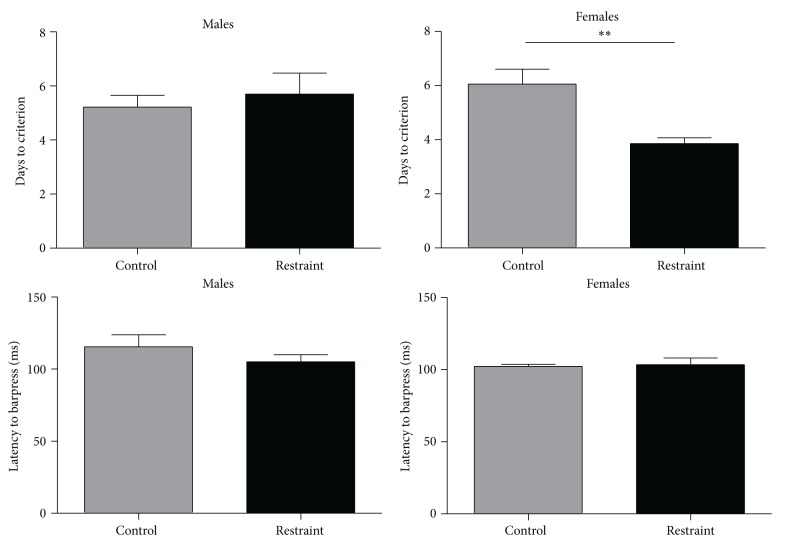
Figure 3.
The upper left graph compares the number of days to reach criterion in appetitive training for control versus restrained males. There were no differences between groups. The upper right graph compares the number of days to reach criterion in appetitive training for control versus restrained females. Restrained animals reached appetitive criterion faster than control animals. The lower left graph compares appetitive response latencies for control and restrained males. There were no differences between groups. The lower right graph compares appetitive response latencies for control and restrained females. There were no differences between groups.

