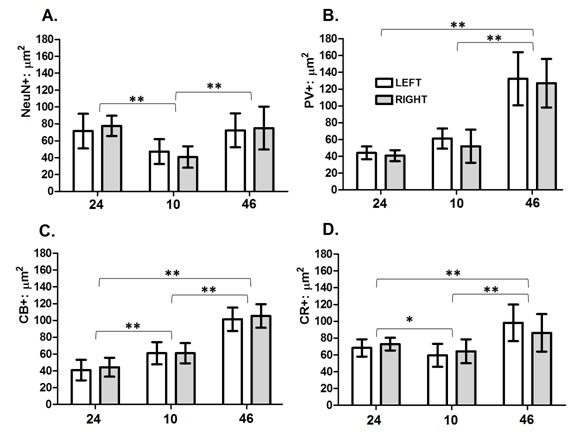
Figure 2. Layer II neuronal subpopulations soma size in human prefrontal areas 24, 10 and 46 correspond to cortical areas analyzed. Left: Left hemisphere. Right: Right hemisphere. NeuN+: µm2: soma size of NeuN-positive neurons in micrometers2. PV+: µm2: soma size of PV-positive neurons in micrometers2. CB+: µm2: soma size of CB-positive neurons in micrometers2. CR+: µm2: soma size of CR-positive neurons in micrometers2. The mean values and the respective standard deviations are shown in the bar graph. *: statistically significant differences at p <0.05; **: statistically significant differences at p <0.01.