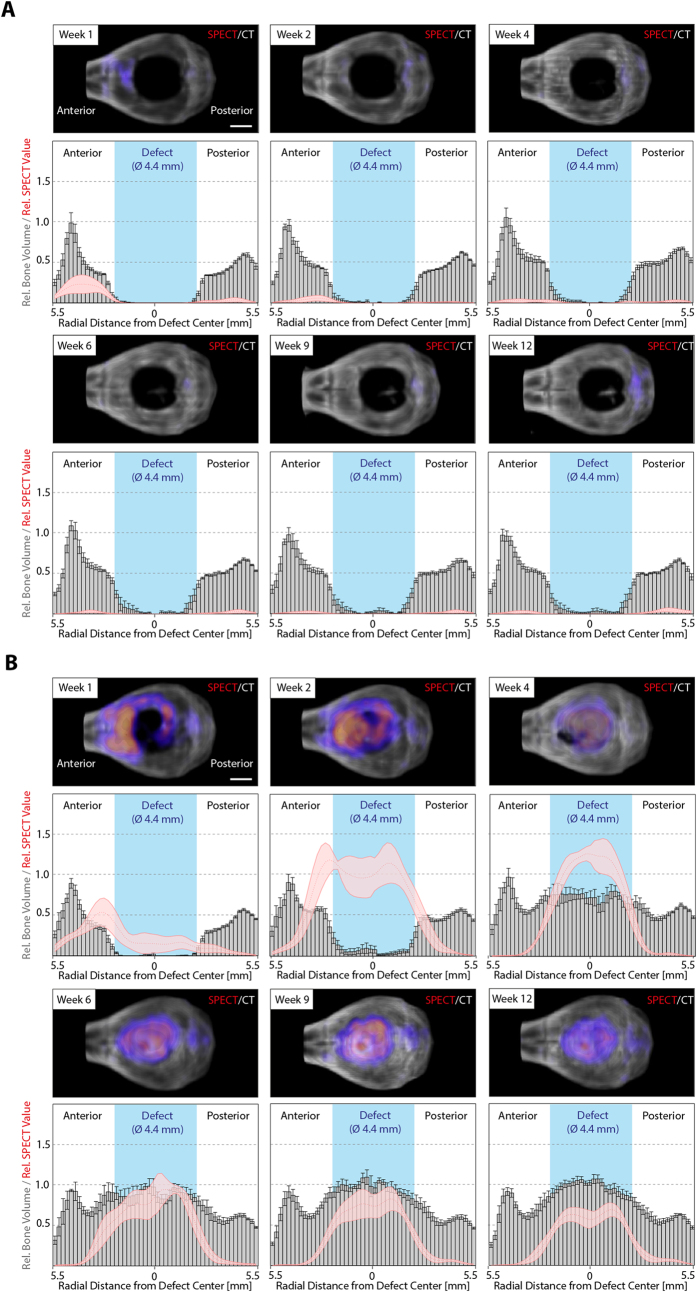
Figure 4. Course of mineralization and 99mTc-MDP accumulation during bone defect healing from the dorsal view.
In vivo SPECT micro-CT measurements were performed to localize 99mTc-MDP accumulation at indicated time points after operation for (A) empty control gels and (B) BMP-2 loaded hydrogels. Upper panels display representative images of merged 3D volume rendered micro-CT (grayscale) and SPECT (pseudo colored) measurements (upper panels). Lower panels show histograms depicting the radial distribution from the defect center of relative bone volume (gray bars) and SPECT values (red line). Data analysis and presentation were performed as described in the methods section. Scale bars = 2 mm. Data is depicted as mean ± SEM (n = 5).

