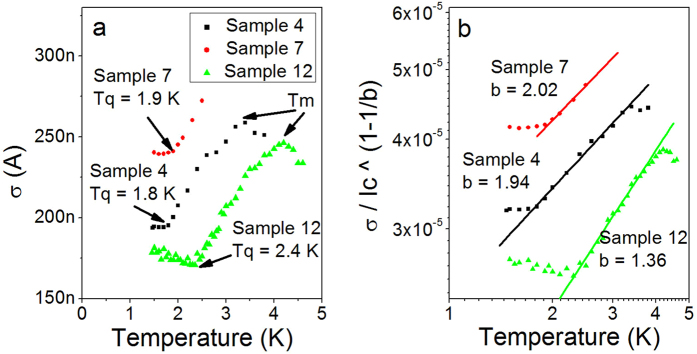
Figure 3.

Standard deviations of switching distributions. (a) The standard deviations of the switching current distributions of Samples 4, 7 and 12 are plotted vs temperature. All three samples show saturation at low temperatures which is known as a signature of macroscopic quantum tunneling. The temperatures at which σ saturates are recorded as the quantum temperatures of the strips and are indicated on the plot as Tq. The multiple phase-slip regime is visible at T > Tm. It is manifested by a drop of the standard deviation with increasing temperature. (b) Fits of  to Tb (solid curves) are performed for Tq < T < Tm in order to find the best-fit power, b, for the temperature dependence according to the Kurkijärvi analysis29. The current dependence in the energy barrier for a phase-slip event has the same power (see Eq. 2). The best-fit powers are shown in the figure and also listed in Table 1. The data and fit for Sample 12 in Figure b are multiplied by a factor of 9 so that all three curves can be easily seen.
