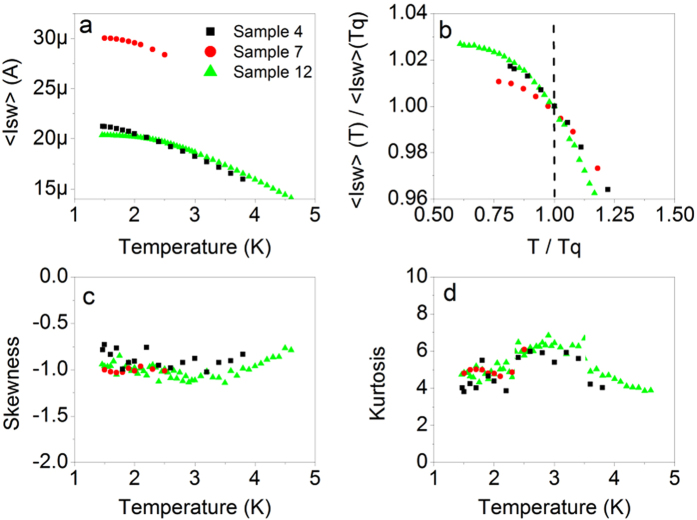
Figure 4.
Switching distribution statistics. The (a) mean switching currents and (b) normalized mean switching currents of Samples 4, 7 and 12 increase with cooling in all temperature regions, including T < Tq. The normalized mean switching current is obtained by dividing the mean switching current by its value at  and the normalized temperature is obtained by dividing T by Tq. The (c) skewness and (d) kurtosis reflect expected values and verify that the saturation in standard deviation is not caused by reaching a base level of noise in the system. At
  skewness and kurtosis trend toward Gaussian distribution values. The legend presented in (a) pertains to all four plots in this figure.

