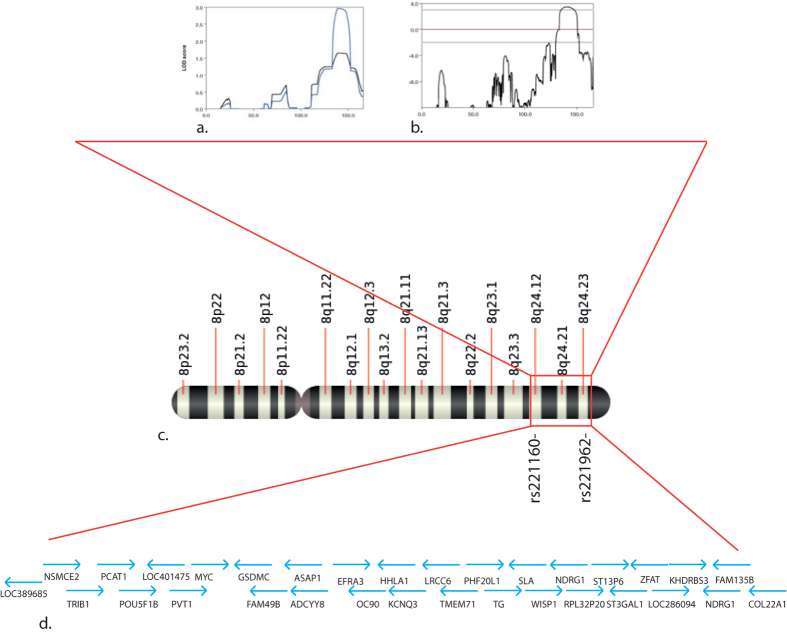
Figure 2. Linkage analysis of PFAPA families.
a) Output of Merlin linkage analysis for linear (black line) and exponential (blue line) non-parametric models. For our study, the exponential model gives a better resolution, since it is indicated for a small number of families and large allelic sharing. b) Output for a parametric model (autosomal dominant with incomplete penetrance). The peak at chromosome 8 is still conserved. c) Location of the linkage interval on the long arm of chromosome 8, between markers rs221160 and rs221962. d) Protein coding genes present in the identified interval.

